Following our examination of DC housing market in August and September, I wanted to update our numbers and graphs for the month of October. Thanks again to POPville and Kevin Wood for the data!
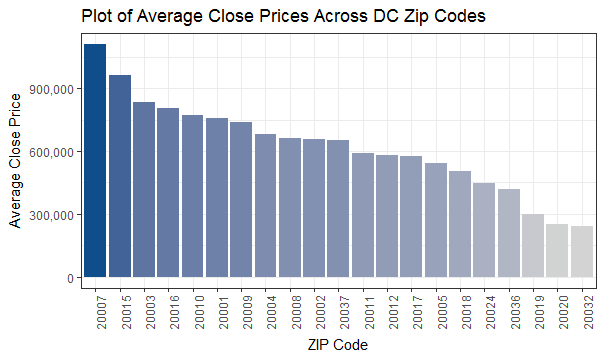
Sales Data by ZIP Code
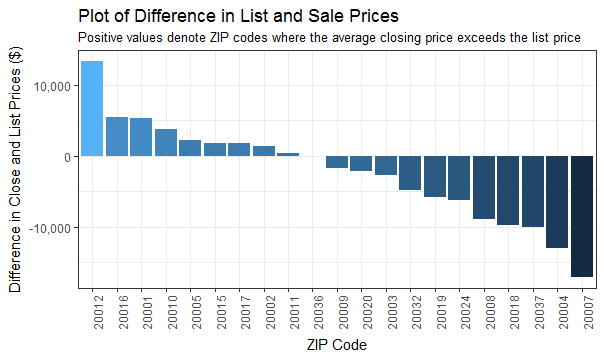
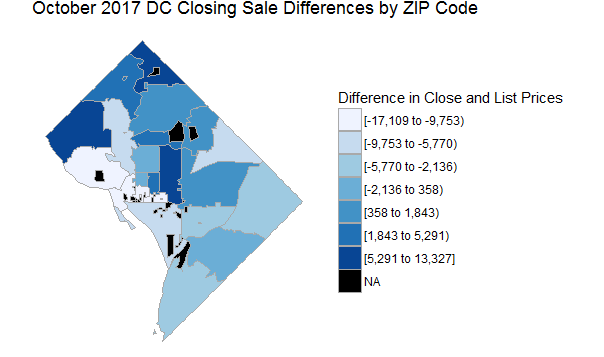
During October, DC’s hottest ZIP shifted upwards into Takoma Park and Shepherd Park (20012). In those neighborhoods, homes sold for an average of $12,000 over closing (compare that to the city-wide average of $1,500 under closing).
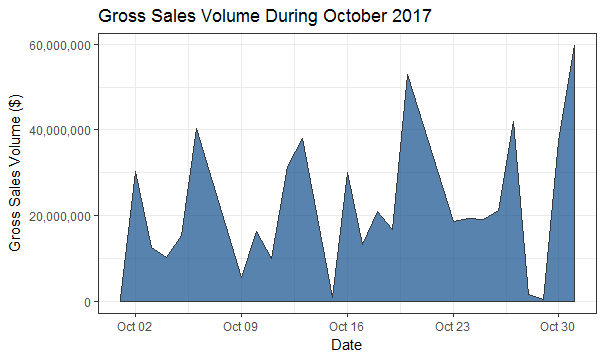
When are Sales Happening?

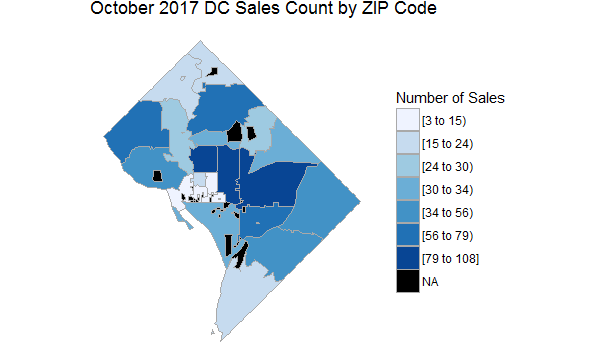
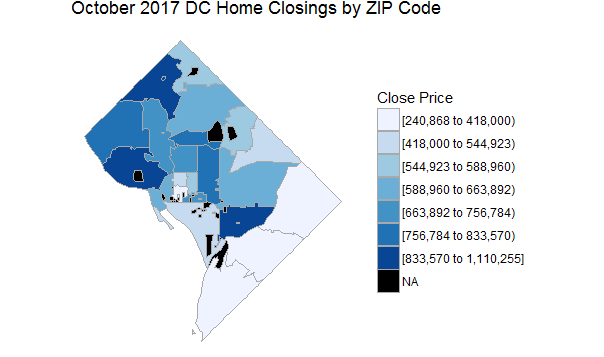
Mapping ZIP Code Sales Data

Sales of the Month (5 Most Expensive Closings)
| address | zip | list_price | close_price | subsidy | bd | bath | half_bath | close_date |
|---|---|---|---|---|---|---|---|---|
| 3303 WATER ST NW #8H | 20007 | 5100000 | 4825000 | 0 | 3 | 3 | 0 | 10/2/2017 |
| 2964 UNIVERSITY TER NW | 20016 | 2995000 | 2800000 | 0 | 4 | 4 | 0 | 10/16/2017 |
| 4520 WESTHALL DR NW | 20007 | 2650000 | 2555000 | 55000 | 6 | 5 | 1 | 10/2/2017 |
| 1310 Q ST NW #6 | 20009 | 2495000 | 2495000 | 0 | 3 | 3 | 1 | 10/17/2017 |
| 1821 KALORAMA SQ NW #11 | 20008 | 2695000 | 2425000 | 0 | 4 | 5 | 2 | 10/20/2017 |
Steals of the Month (5 Least Expensive Closings)
| address | zip | list_price | close_price | subsidy | bd | bath | half_bath | close_date |
|---|---|---|---|---|---|---|---|---|
| 3939 PENNSYLVANIA AVE SE #202 | 20020 | 74900 | 74900 | 0 | 2 | 1 | 0 | 10/5/2017 |
| 2838 HARTFORD ST SE #202 | 20020 | 70000 | 73000 | 0 | 2 | 1 | 0 | 10/3/2017 |
| 705 BRANDYWINE ST SE #302 | 20032 | 69000 | 69000 | 0 | 1 | 1 | 0 | 10/23/2017 |
| 1907 GOOD HOPE RD SE #206 | 20020 | 50000 | 47500 | 0 | 1 | 1 | 0 | 10/6/2017 |
| 3208 G ST SE | 20019 | 307400 | 27800 | 0 | 5 | 2 | 0 | 10/25/2017 |