Following our examination of DC housing market in August, I wanted to update our numbers and graphs for the month of September. Thanks again to POPville and Kevin Wood for the data!
Sales Data by ZIP Code
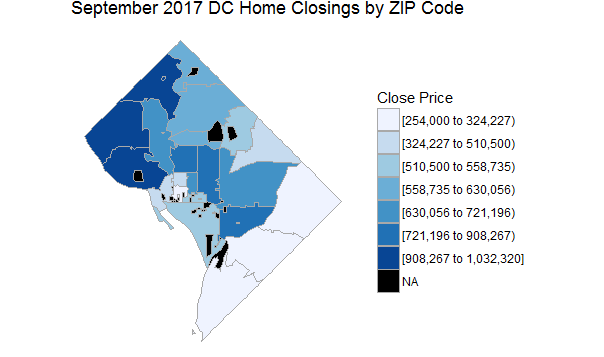
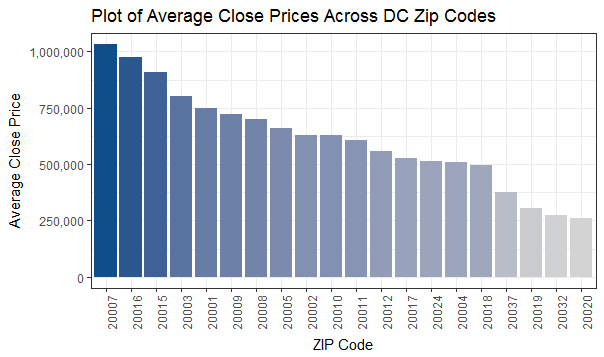
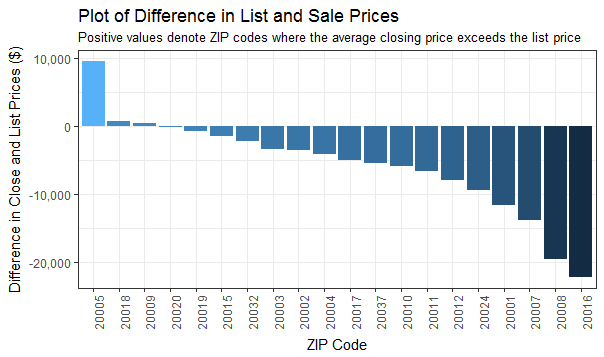
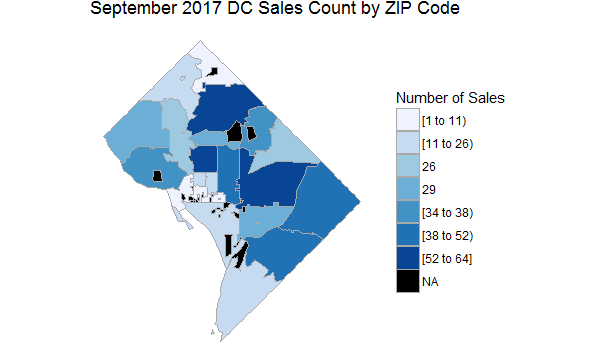
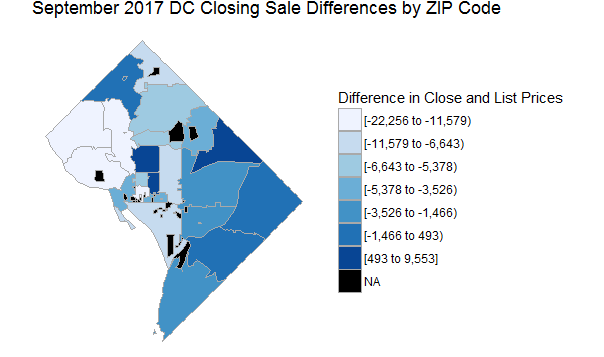
Nothing crazy here compared to last month - Northwest DC still dominates the most expensive sales. Some movement in terms of “hot” zips though, with Logan Circle/Penn Quarter (20005) coming in with the highest difference between asking and closing prices.
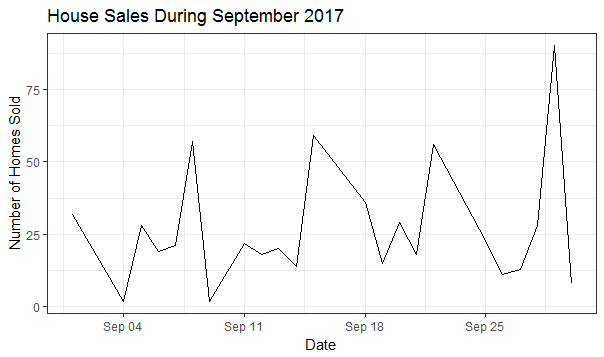
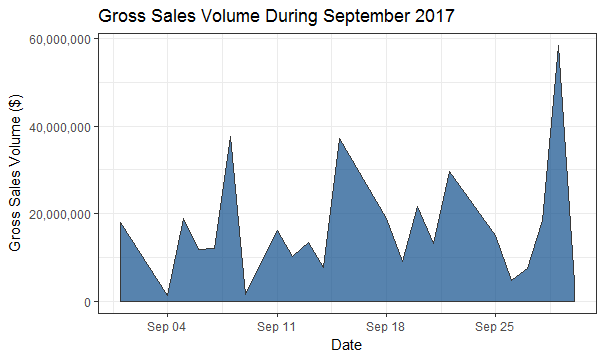
When are Sales Happening?
Similar to August, note the end-of-month sales spike. Sellers - be aware!
Mapping ZIP Code Sales Data

Sales of the Month (5 Most Expensive Closings)
| address | zip | list_price | close_price | subsidy | bd | bath | half_bath |
|---|---|---|---|---|---|---|---|
| 1909 FOXVIEW CIR NW | 20007 | 3995000 | 3850000 | 0 | 6 | 6 | 1 |
| 3125 CHAIN BRIDGE RD NW | 20016 | 3999000 | 3500000 | 0 | 7 | 7 | 1 |
| 1310 Q ST NW #2 | 20009 | 2845000 | 3000000 | 0 | 3 | 3 | 1 |
| 612 3RD ST SE | 20003 | 2798999 | 2650000 | 0 | 7 | 7 | 2 |
| 1310 VERMONT AVE NW | 20005 | 2500000 | 2600000 | 0 | 4 | 3 | 1 |
Steals of the Month (5 Least Expensive Closings)
| address | zip | list_price | close_price | subsidy | bd | bath | half_bath |
|---|---|---|---|---|---|---|---|
| 3937 S ST SE #8A | 20020 | 75000 | 64050 | 0 | 2 | 1 | 0 |
| 1210 R ST NW #P-84 | 20009 | 50000 | 50000 | 0 | 0 | 0 | 0 |
| 955 26TH ST NW #P33 | 20037 | 45000 | 40000 | 0 | 0 | 1 | 0 |
| 3031 30TH ST SE #5 | 20020 | 20000 | 22000 | 660 | 3 | 1 | 0 |
| 2711 Q ST SE #203 | 20020 | 1490 | 1490 | 0 | 1 | 1 | 0 |