Soto’s Debut
Nationals fans eagerly anticipated Juan Soto’s arrival to the major leagues, and boy, did he deliver. In his second MLB at-bat, and his first start, Soto laced a 422 foot drive off Robbie Erlin, driving in 3 and showing why he made such meteoric rise through the National’s minor league system.
Soto’s promotion was the result of a particularly ill-timed injury to do-everything superstar Howie Kendrick, who was pressed into an everyday role at second base and the outfield following injuries to Daniel Murphy and Adam Eaton. With Kendrick now out for the season following Achilles surgery and Eaton recovering from ankle surgery, Soto looks to get plenty of run for the next few months as the Nationals assess exactly how special he is.
Getting a sense of Soto’s long-term MLB potential is going to be particularly important when considering Bryce Harper’s free agency and contract demands. One potential future outfield for the Nationals is Soto, Adam Eaton, and Victor Robles. Eaton has struggled with injury during his time with the Nationals, but has excelled when on the field. Robles showed very well last year, and has all the tools to be a future All-Star. If Soto can prove his ceiling is similarly high, the Nats should have a lot of confidence in their outfield position group, even if Harper chooses to leave in free agency.
Bryce Harper’s Batting Average - Ominous sign, or just bad luck?
Speaking of Bryce Harper…… despite leading the National League with 15 home runs, his batting average currently sits at .238, nearly 50 points lower than his career average. Given Harper’s reputation as a power hitter who can still for a high average, the disconnect between these numbers begs the question: which of these statistics is the abberation? Should he expect positive regression in his batting average moving forward? Or does he profile as a low-average, high power hitter moving forward? Let’s dig into the numbers and find out.
Strikeout and Walk Rates
To begin, it’s insightful to look at Harper’s strikeout and walk percentages. Harper currently leads all of Major League Baseball with 43 walks, and his 20.7% walk rate (a career high) boosts his on-base percentage to a heady .394, even in spite of the low batting average. Additionally, his strikeout rate clocks in at a career low 16.7%, meaning that he is walking a good deal more than he is striking out. While neither of these figures directly impact his BABIP, they are useful in constructing a model of Harper as a hitter - more patient and whiffing less than ever before.
BABIP
What offers some potential in understanding Harper’s low batting average is his batting average on balls in play (BABIP). Despite averaging a .316 BABIP over the course of his career, Harper’s BABIP on the season currently sits at .200 - fifth lowest amongst qualified hitters in all of baseball. Typically this implies one of two things: the hitter is making poor contact, leading to easier outs, or he is getting unlucky. If he’s been unlucky, one would expect positive regression to push Harper’s BABIP back towards his career average, which would increase his batting average in turn. Let’s look at the quality of Harper’s contact to see.
Batting Average and Exit Velocity
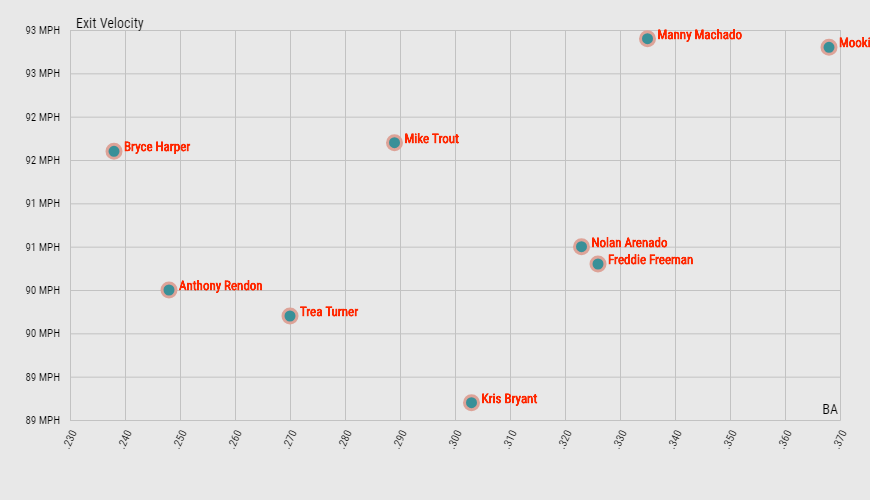
To strip out the influence of luck and defense, and focus merely on quality of contact, we can look at a hitter’s average exit velocity. This statistic measures the speed of hits off the bat, and can be used as a proxy to judge how well the hitter is striking the ball. Harper fares well by this metric, with a 92 mph average exit velocity that measures up favorably against some of the MLB’s best players. The chart below shows this fact, while also showing what an outlier Harper’s low average is for someone hitting the ball so hard.
Expected Batting Average and Exit Velocity
Luckily for us, MLB’s Statcast also has a statistic called Expected Batting Average (xBA) - basically an abstraction of batting average which removes the influence of luck and the role of BABIP in determing one’s average, and relying on the underlying quality of contact. Here’s the definition of xBA straight from the Statcast website:
- Expected Batting Average (xBA)
- Expected batting average (xBA) is formulated using the Statcast metric Hit Probability, which was introduced before the 2017 season. With Hit Probability, each batted ball is assigned a percentage based on how often comparable balls – in terms of exit velocity and launch angle – have become hits since Statcast was implemented Major League wide in 2015. For example, a batted ball with a Hit Probability of 70 percent is given that figure because balls with a similar exit velocity and launch angle have become hits seven out of 10 times. Knowing the expected outcomes of each individual batted ball from a particular player over the course of a season allows for the formation of said player’s expected batting average on balls in play. Real-world strikeout totals are then added in, resulting in a player’s seasonal expected average based on the quality of contact, instead of the actual outcomes. Expected batting average is more indicative of a player’s skill than regular batting average, as xBA removes defense from the equation. Hitters, and likewise pitchers, are able to influence exit velocity and launch angle but have no control over what happens to a batted ball once it is put into play.

This chart, which merely substitutes xBA for BA, gives a much more favorable impression of Harper’s performance so far. Instead of a .238 hitter, xBA judges Harper as having the underlying qualities of a .300+ hitter, with a batted-ball profile very similar to that of Mike Trout.
Takeaways
So, back to the original question: should Harper expect positive regression in his batting average moving forward? The numbers clearly indicate yes, provided that he continues to make hard contact as he has done so far this season. Moving forward, it will be interesting to track his underlying hitting statistics (exit velocity, BB% and K%) and see if the the ongoing disparity between hit quality and batting average continues, or if this early-season trend is ironed out by the ups and downs of Lady Luck.
All statistics and graphics generated using analysis tools from MLB Statcast