While I was working on my last post about NFL salary cap allocation, I struggled with how best to present the information. I knew I wanted the focus to be on outliers, but was finding a standard pie chart to be dull, and bar chart to be hard to compare. Fortunately, I stumbled upon the circumplex chart and realized this was exactly what I was looking for.
I found a number of good resources to help me on my way, most notably this post by Learning R, but ultimately ended up heavily customizing the charts until they felt right. Let’s take a look at what it takes to build and customize one of these charts!
Load the Data Frame
# Import tidyverse to have access to dplyr and ggplot2
library(tidyverse)

# Create a simple dummy data frame with columns "variable" and "value"
data <- data.frame(
  variable = c(
    "Group 1",
    "Group 2",
    "Group 3",
    "Group 4",
    "Group 5",
    "Group 6",
    "Group 7",
    "Group 8",
    "Group 9",
    "Group 10"
  ),
  value = sample(10, replace = TRUE))
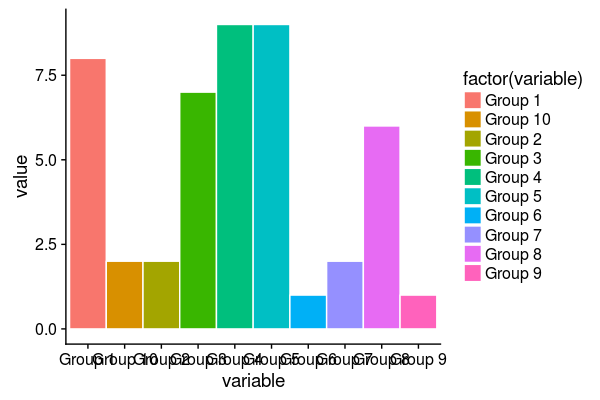
Create a Bar Plot
# Create a simple column chart using the data frame, colored by variable
plot <- ggplot(data,
       aes(
         x = variable,
         y = value,
         fill = factor(variable)
       )) +
  geom_col(width = 1, color = "white")

# View the plot
plot
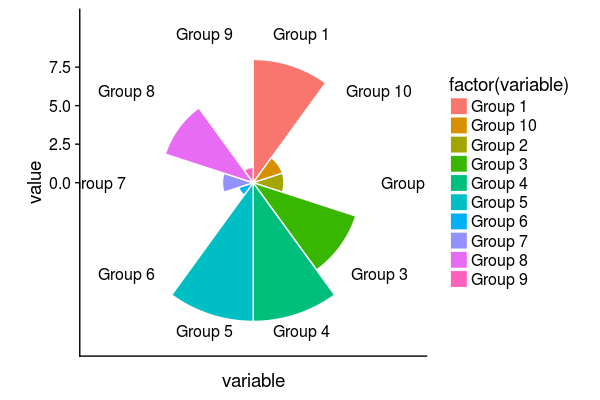
Convert to Polar Plot
# Convert the coordinate system to polar
plot <- plot + coord_polar()

# View the plot
plot
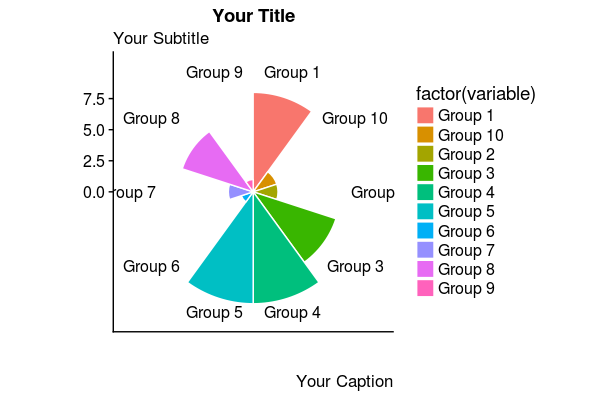
Add Titles
# Add descriptive text to the plot
plot <- plot + labs(
    x = "",
    y = "",
    title = "Your Title",
    subtitle = "Your Subtitle",
    caption = "Your Caption"
  )

# View the plot
plot
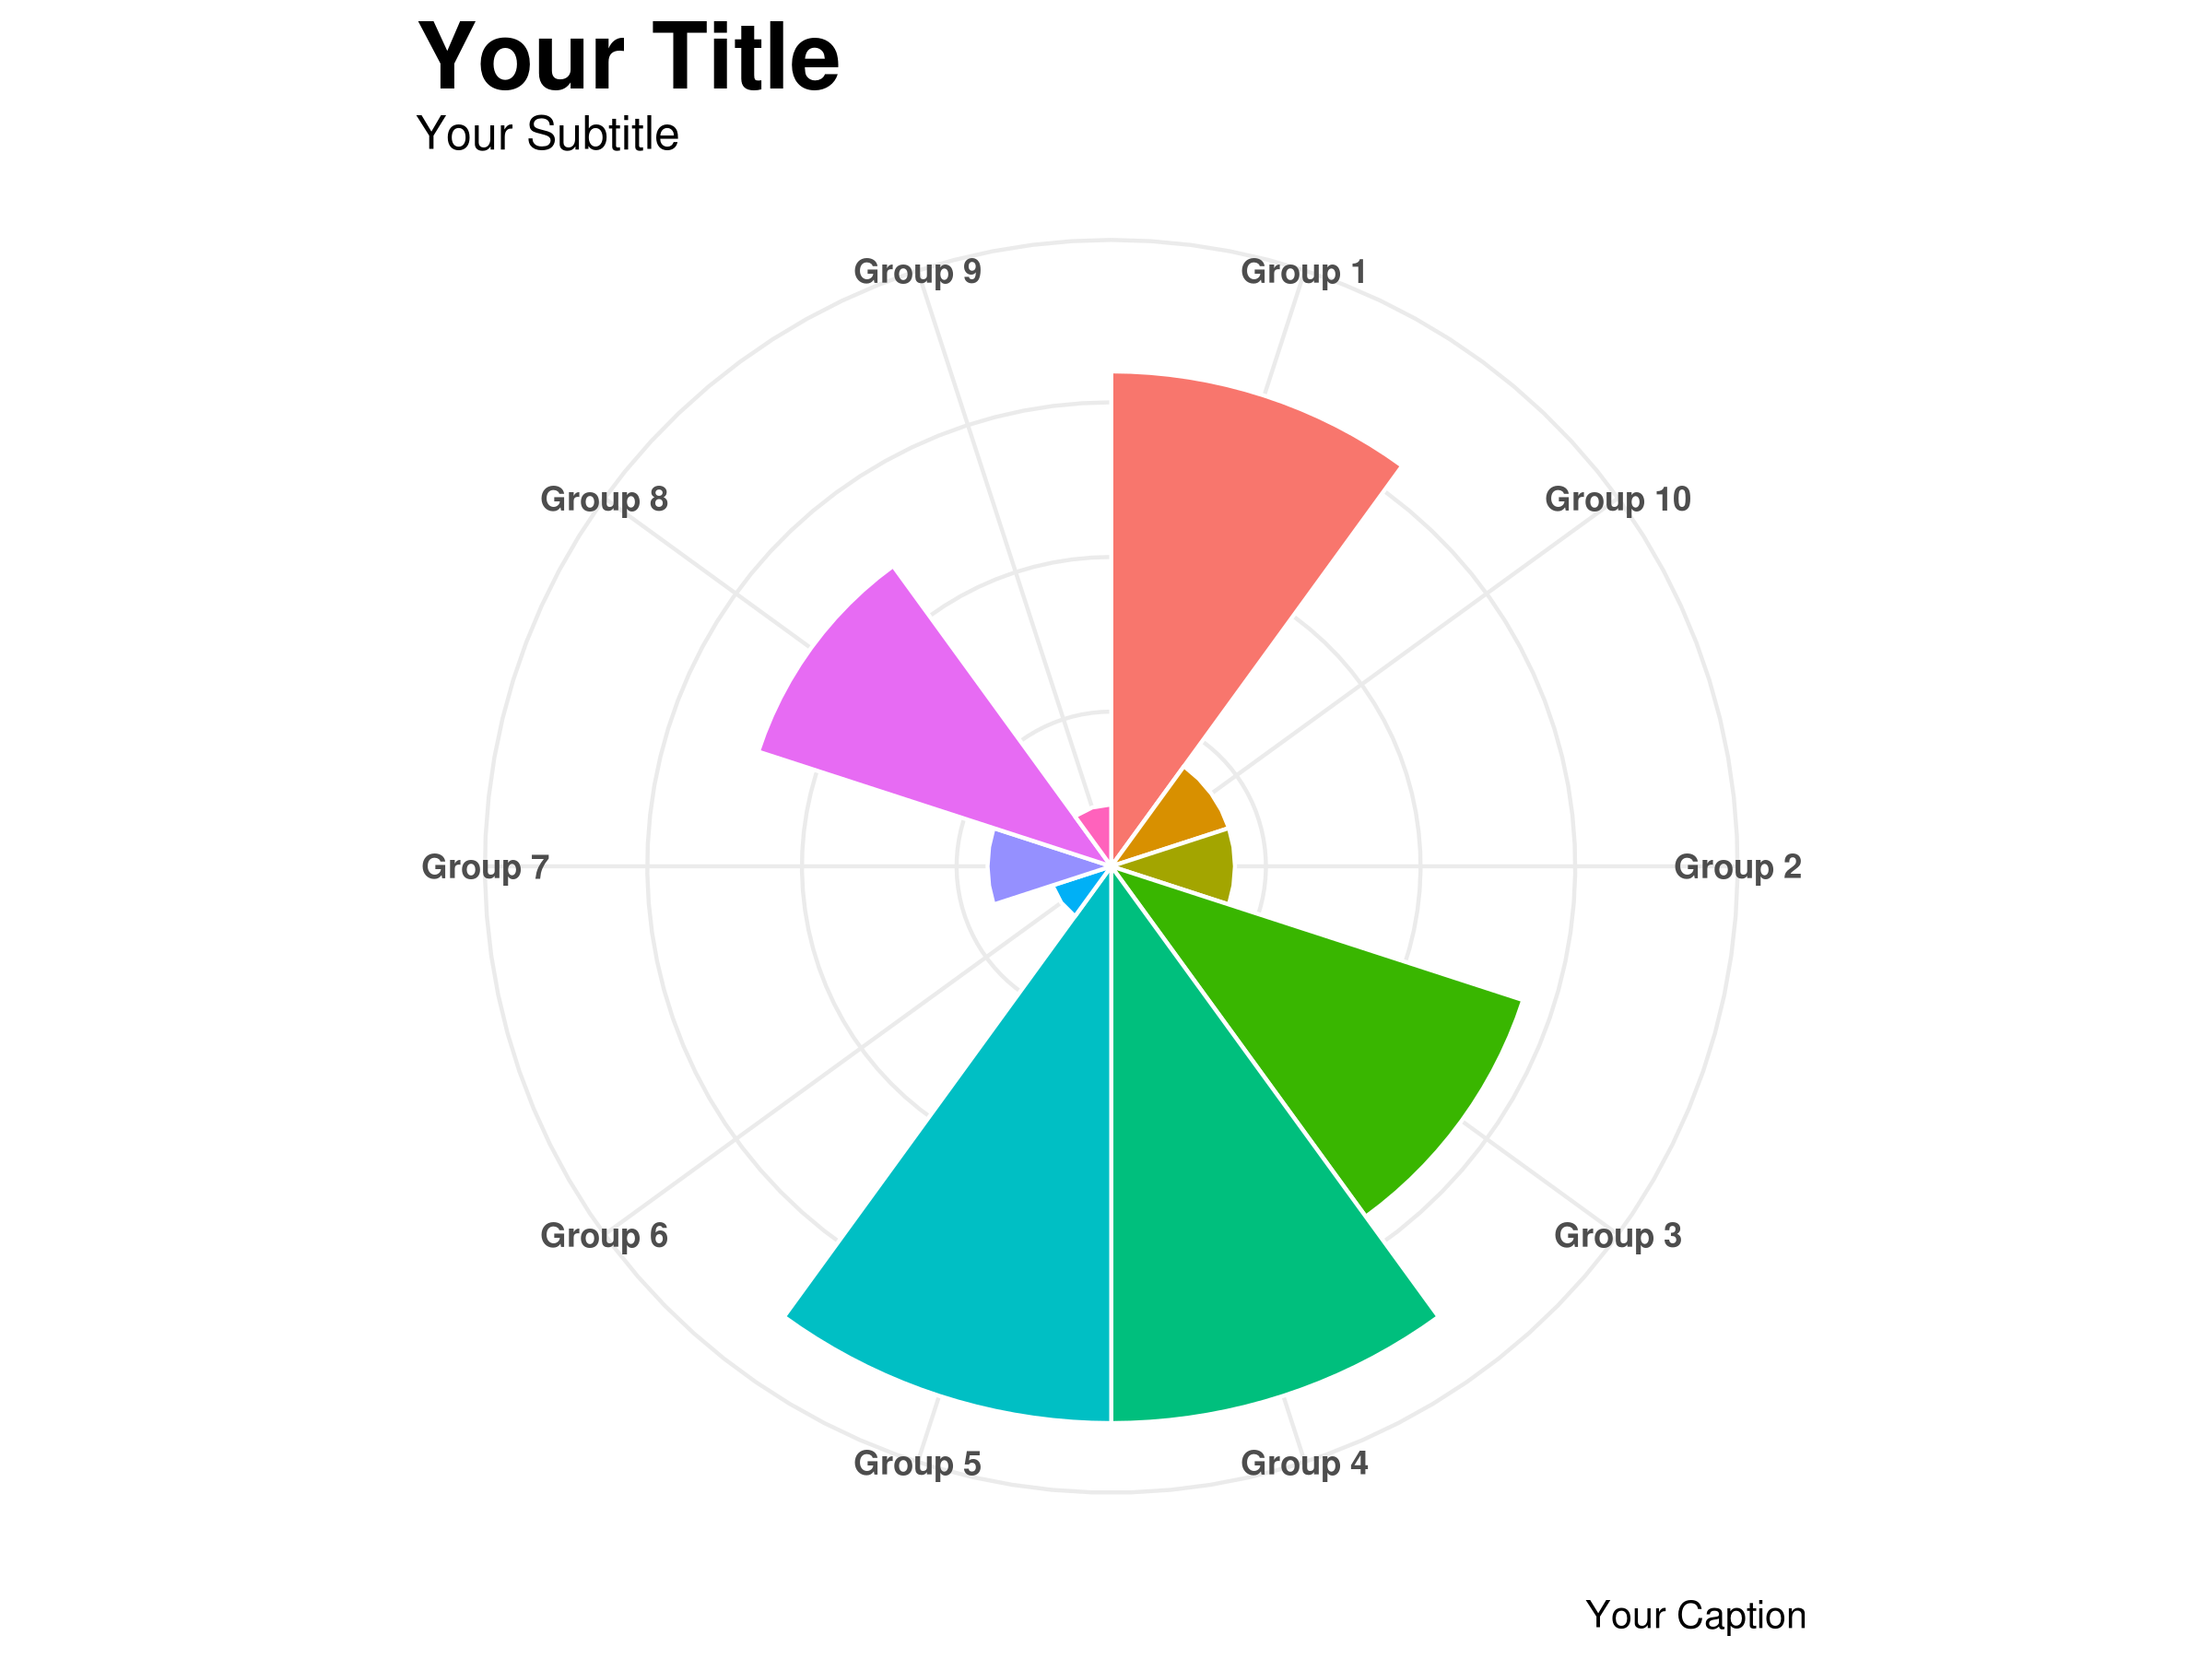
Clean and Theme the Plot
# Clean up and theme the plot
plot <- plot +
  # Assign the ggplot2 minimal theme
  theme_minimal() +

  # Remove legend, axes, text, and tick marks
  theme(
    legend.position = "none",
    axis.title.x = element_blank(),
    axis.title.y = element_blank(),
    axis.ticks = element_blank(),
    axis.text.y = element_blank(),
    axis.text.x = element_text(face = "bold"),
    plot.title = element_text(size = 24, face = "bold"),
    plot.subtitle = element_text(size = 12)
  )

# View the plot
plot

Save and Resize the Plot
ggsave("YOUR_FILENAME.png", width = 8, height = 6, unit = "in")