One of the interesting facts that I’ve learned as I continue to settle down in Santa Monica is that since May of 2015, the City of Santa Monica has effectively banned short-term home/vacation rentals. This decision was made with an eye to AirBnB and other online leasing platforms, and with the intention that Santa Monica’s few apartment buildings not turn into de-facto hotels with new people in and out every weekend. As an alternative, the City has launched a “home-sharing” program which allows homeowners who register to host a visitor in their home for up to 30 days, as long as the resident is also living there concurrently.
Because this is a publicly-administered program through the City, the data about registered users and homes is in the public domain. Upon realizing this, and seeing the dataset had latitude and longitude detail for each registered home, I got very excited about using this data to help map Santa Monica.
Mapping Available Home-Shares
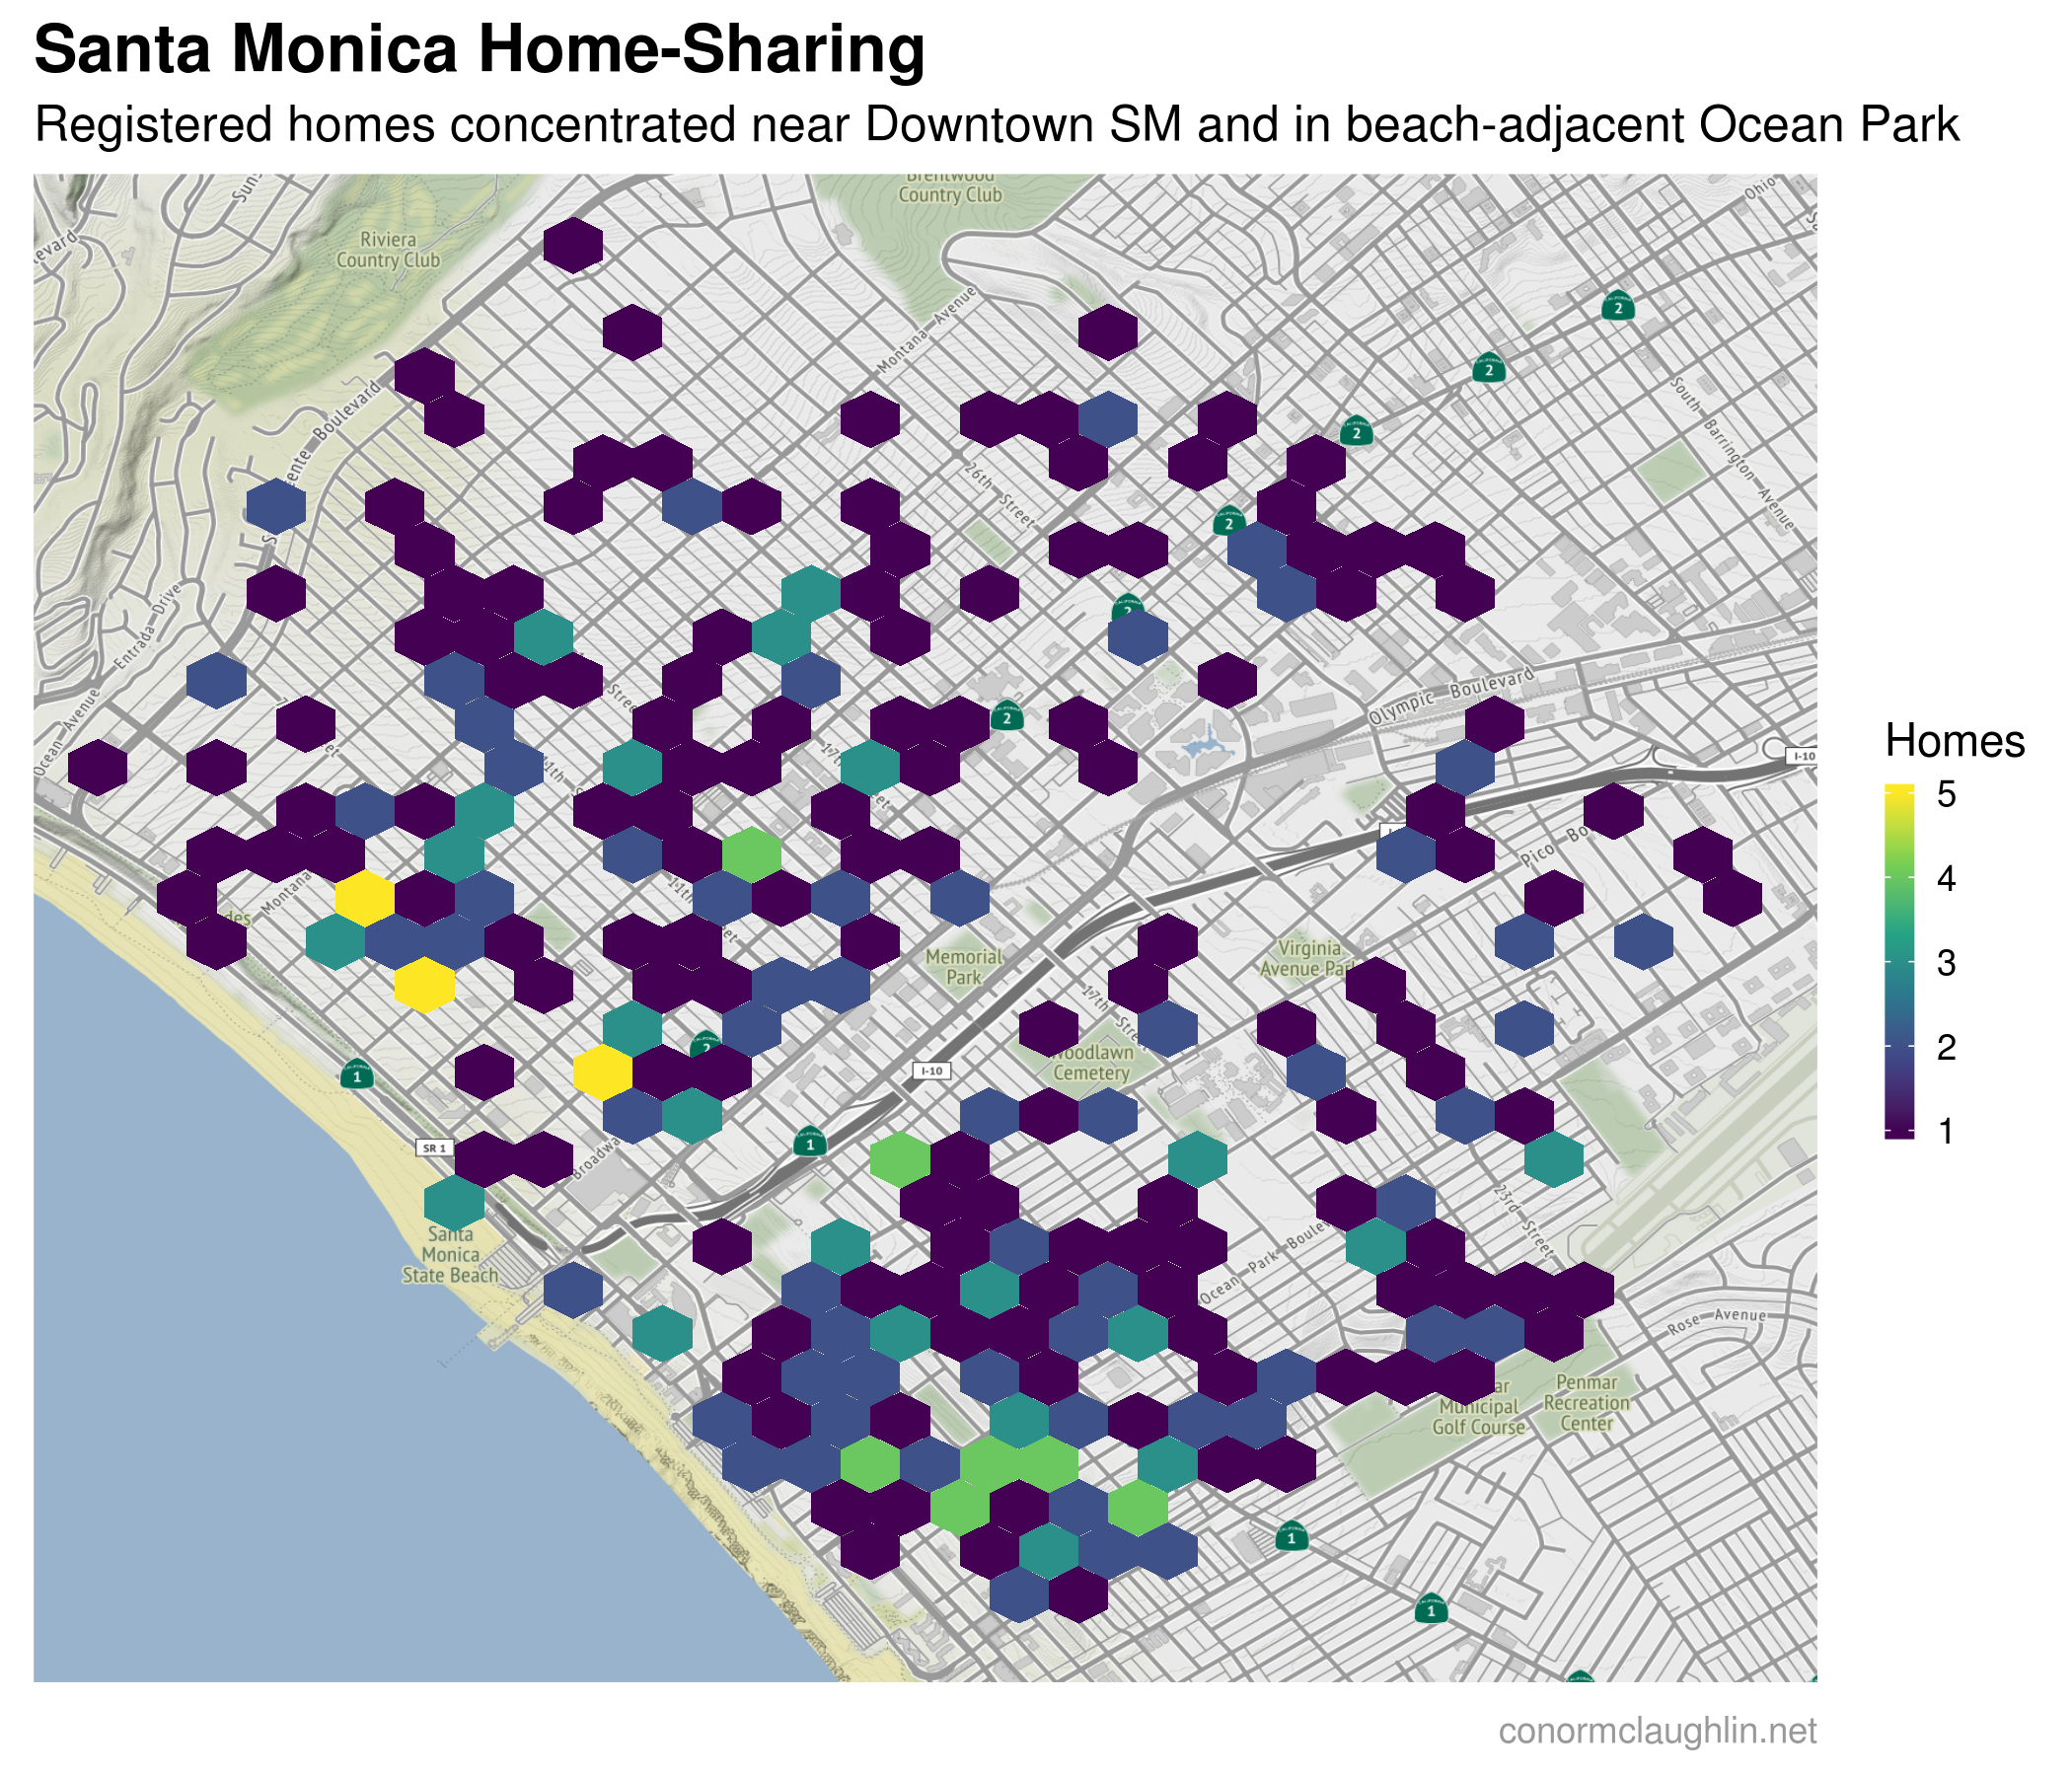
The first thing I wanted to do with the dataset (which has about ~ 350 total homes registered) was to create a heatmap of locations in Santa Monica and see what neighborhoods these homes might be concentrated in. After experimenting with building a tiled heatmap in ggplot, I decided to switch approaches just slightly to binning by the registered home-sharing locations into a series of hexagons, and then overlaying the hexagonal layer on top of a map of the city.
I wasn’t surprised to see a number of hotspots showing up in the middle-left of the chart, given that corridor where those hex areas are located is close to the Promenade, easily accessible to the beach, and has a relatively high proportion of dense apartment buildings. What I found more surprising was was how much more dense the area in the bottom right of the map (Ocean Park in Santa Monica) is compared to more northerly Santa Monica (judging by registered home shares at least). While there aren’t any yellow areas in Ocean Park, there is a large, contiguous cluster of home-shares available between the beach and Lincoln Boulevard, towards the border of SM with Venice.
Clustering Home-Shares to Define Rough Neighborhood Boundaries
The other aspect of this data that I thought would be fun to map is the natural clustering of available homes into neighborhoods. Santa Monica already has a number of well-labeled neighborhoods (Ocean Park, Downtown, North of Montana, Mid-City, etc), so I was curious to see how well the registered homes in our data set created neighborhood groupings of their own.
To determine which homes would fit into which neighborhood clusters, I applied a k-means clustering algorithm to the data. This algorithm works by breaking the data into a certain number of groups (picked by the user), and then assigning points to each of the clusters in a way which minimizes the distance from the center of each cluster.
Visualizing Different Quantities of Clusters
To make visualizing the different k-means clusters as simple as possible, I recreated a map of the home-sharing dataset similarly to earlier. However, this time I plotted the locations of each home on the map and assigned a color to each depending on which neighborhood cluster they were grouped in. I then plotted the change in map clusters over time as the number of cluster centers used in the k-means algorithm increases, from one cluster at the start (a single color for the map) all the way to nine different clusters at the end.
Animated Map of Santa Monica
Mapping Santa Monica into Five Neighborhoods
While it is super fun to look at the animated map dividing the homes into smaller and smaller neighborhoods, I found the maps with lots of clusters to be a tiny bit overwhelming. With eight and nine different clusters active, they become granular enough that I’m not sure they reflect the most realistic neighborhood boundaries. For my money, I think that five clusters is the sweet spot in this dataset - enough to break the map into real-life neighborhoods, but not so many that some neighborhoods are being artificially divided/overfit.
