I was recently reading Hacker News and noticed a post linking to the USCIS H1-B data repository, which contains information on the H1-B Visa applications process and statistics about visa submission, approval, and rejection by Citizen and Immigration Services.
As a bit of background, the H1-B visa program was created to allow US employers to employ foreign nationals in jobs requiring specialized knowledge and a bachelor’s or master’s degree. H1-B visas must be sponsored by an employer, and are typically valid for 3 - 6 years. While there is a cap of 65,000 visas that can be awarded each year, there are a number of exemptions for research institutions, particular countries of origin, and rollover between years that make the practical number of visas available much higher. Furthermore, there are 20,000 H1-B visas available to individuals who possess a master’s degree or higher from an American university. This means the total number of H1-B visas available in the lottery is in the 150,000 - 200,000 / year range, for both initial and continuing visas.
To see what stories this data might contain, I downloaded the last five years of data from the USCIS data portal and got busy analyzing! One note on the data - the 2019 data set is for the 2019 Fiscal Year, which started October 1, 2019, and as such the 2019 data includes only half a year of data. Keep this in mind when viewing total-based charts.
Applicant Volume and Approval Rates
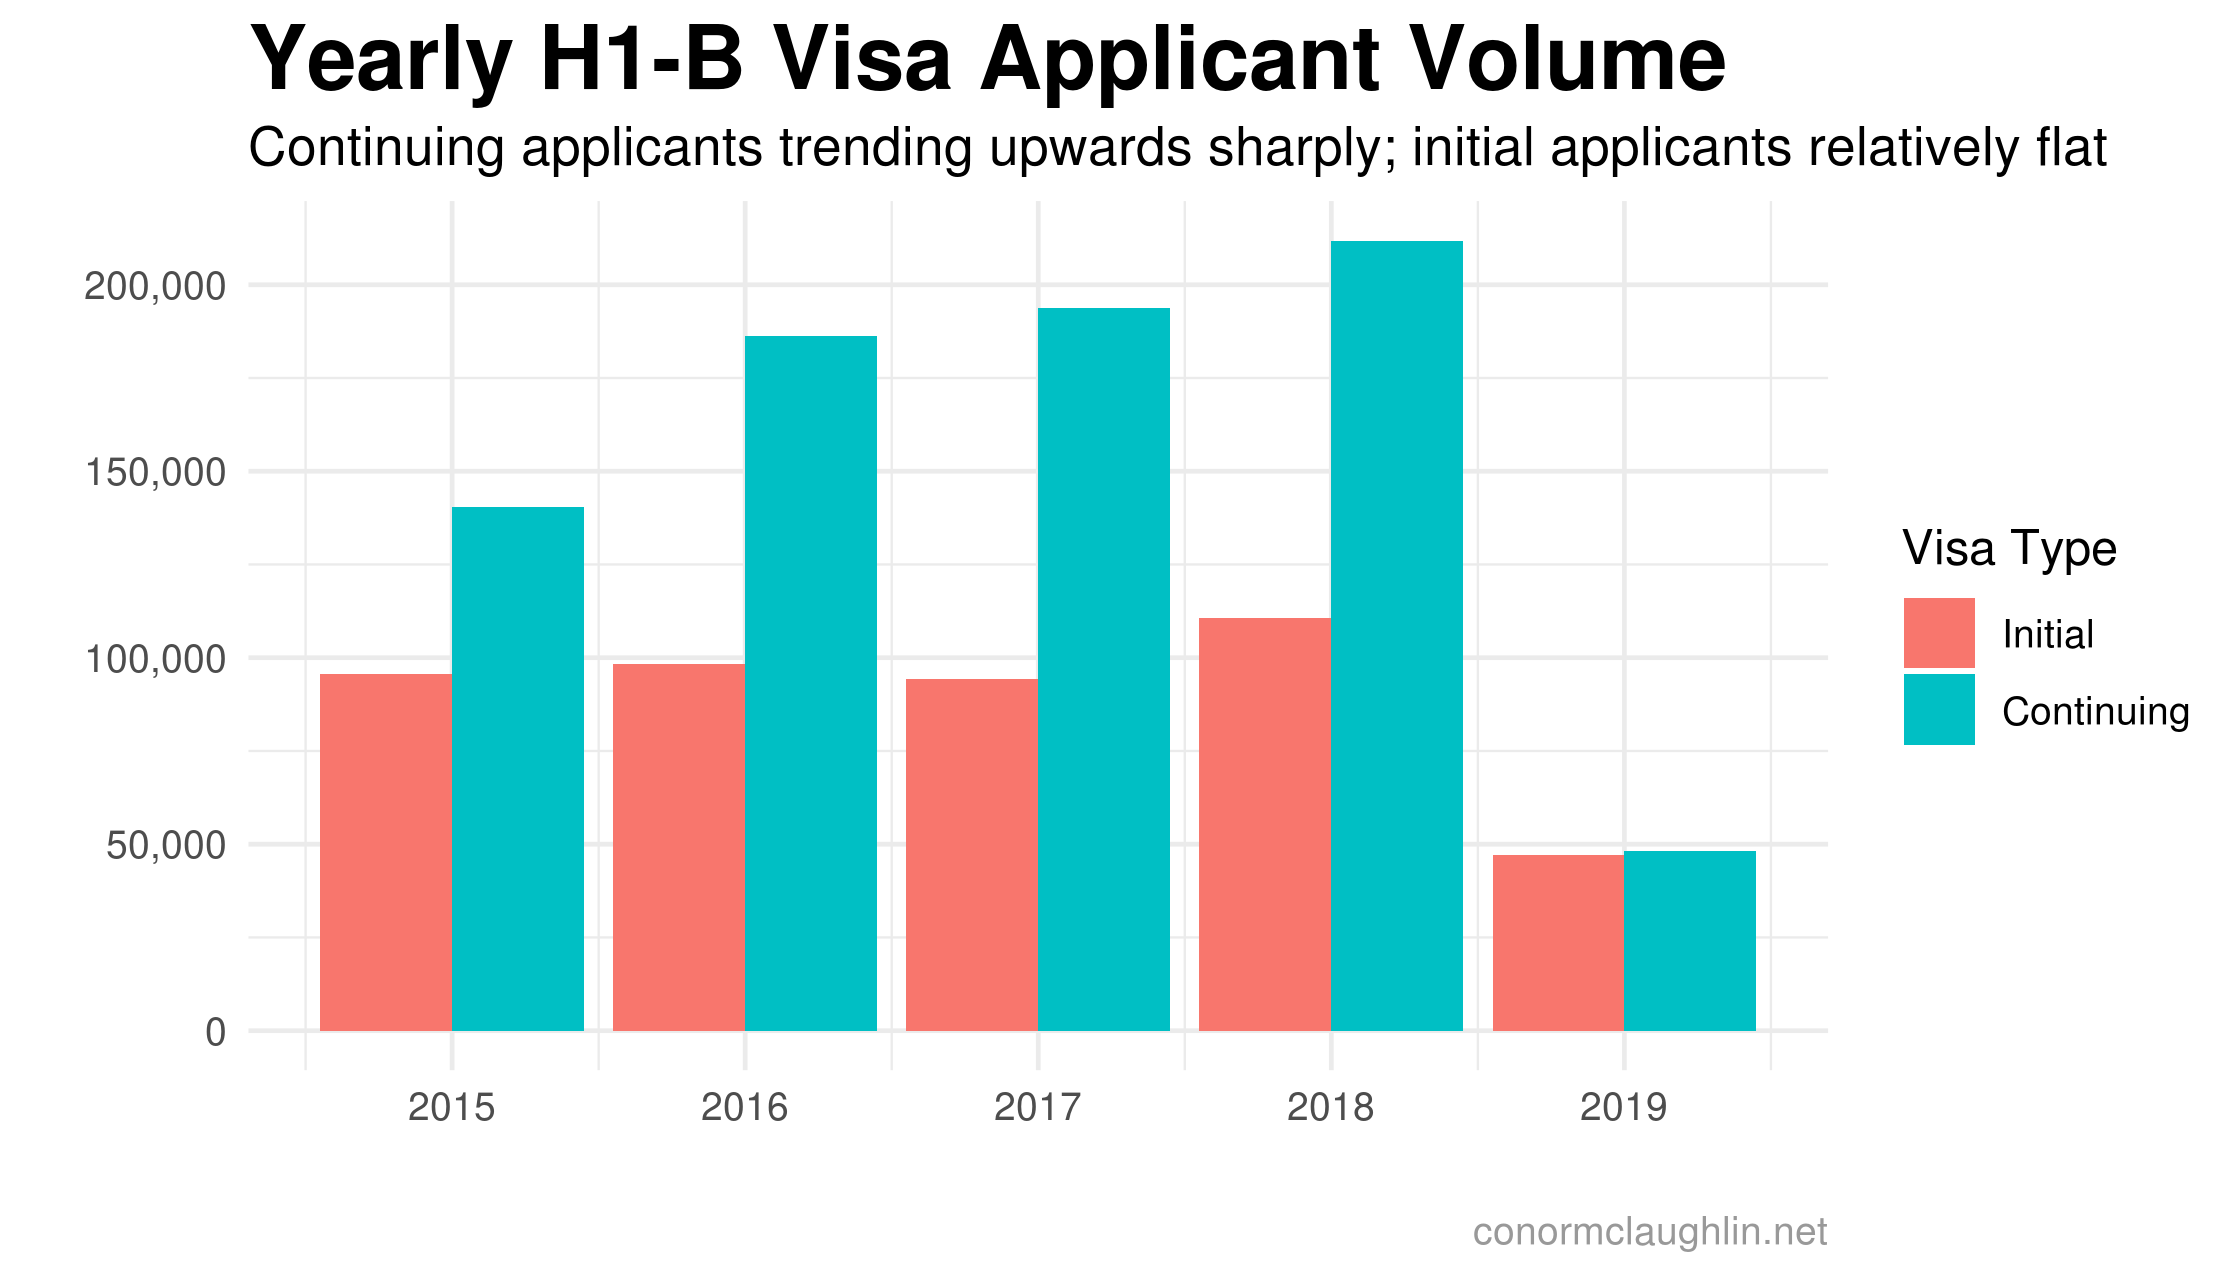
The first thing I noticed when unpacking the macro-trends over the past five years was a significant uptick in continuing visa applications. While initial visa applications are up a smidge, there has been over a 40% increase in continuing applications from 2015-2018.
While 2019 is still only half-complete, it is interesting to see the volume of continuing visa applications is hovering right around the volume of initial applications. It seems like there has historically been a 2x split between the groups, and makes me wonder whether there have been significant changes in the FY2019 visa process, or if the back half of the year typically recieves a greater volume of continuing visas than the front half.
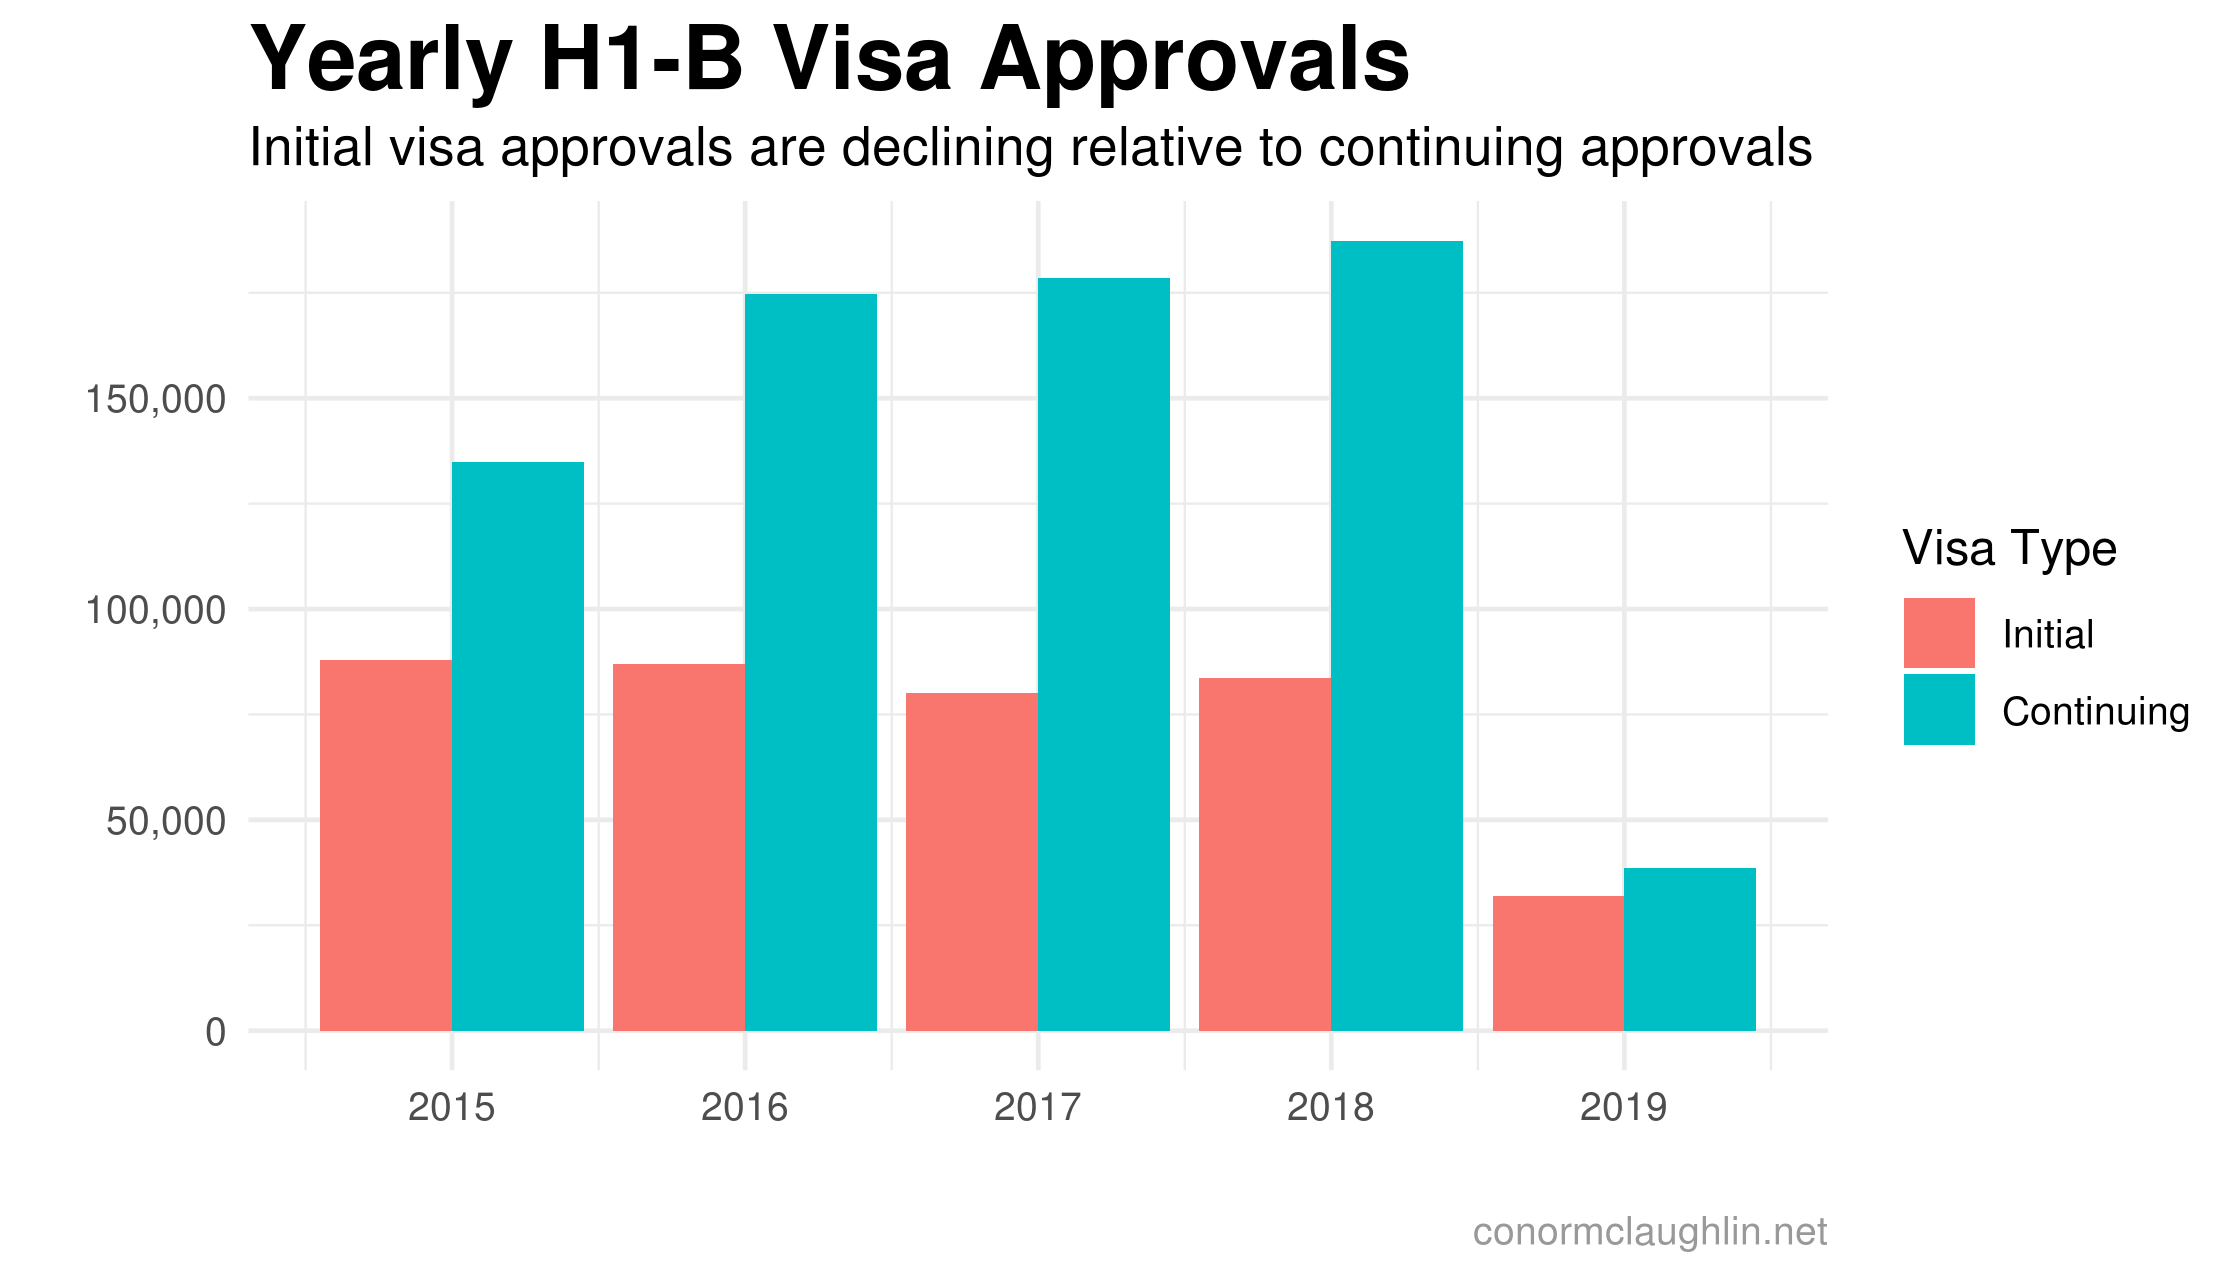

While the number of applicants has been ticking upwards, the approval rate has been steadily moving the opposite direction. Interestingly, the continuing visas exhibit less of a drop-off in approval rate than the new initial visa applications, which exhibit a sharp dropoff from over 90% in 2015 to under 70% in 2019. This is just conjecture, but it’s possible that the Trump administration has made a preference shift within USCIS to award fewer visas of all kinds, while particularly restricting the number of new H1-Bs.
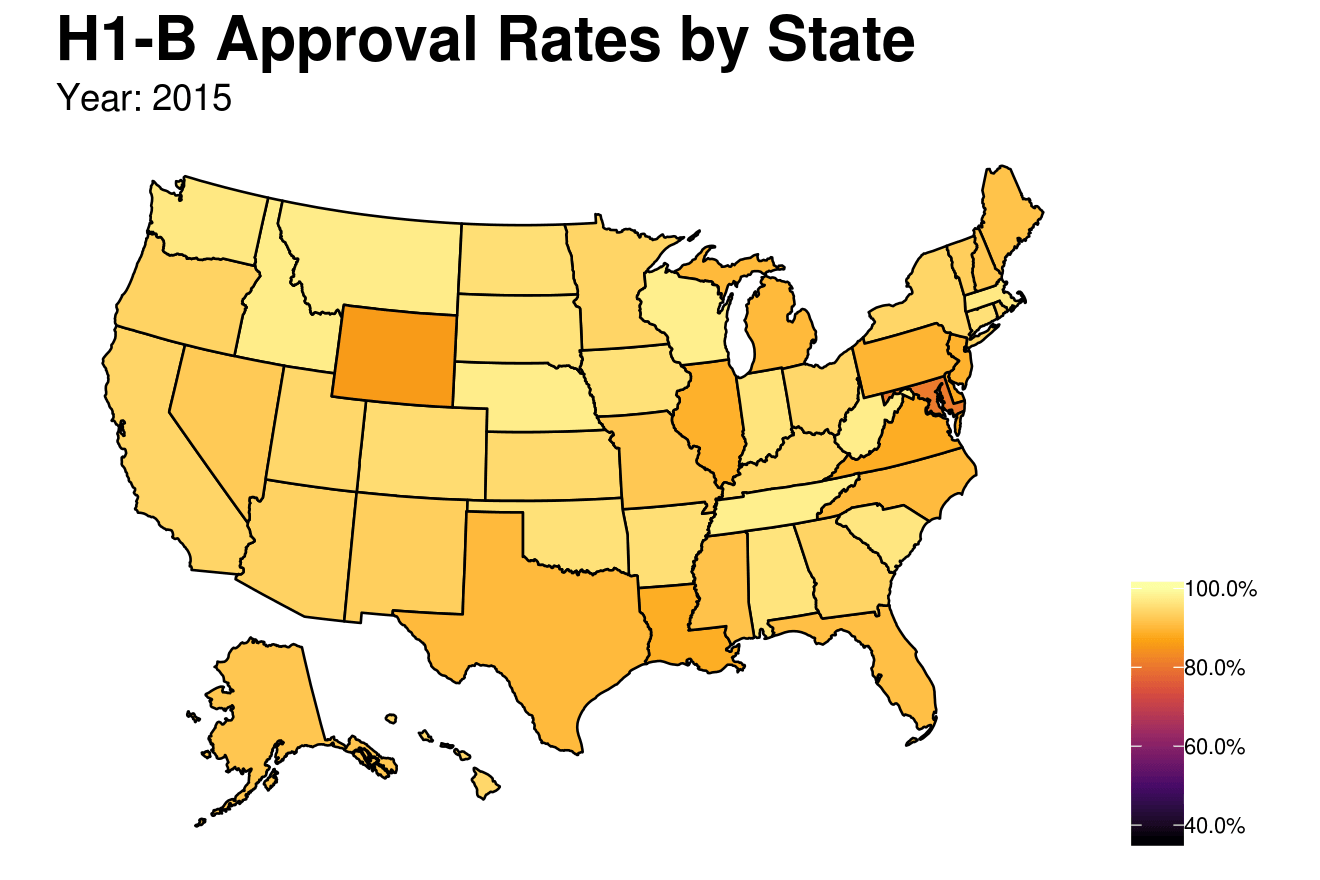
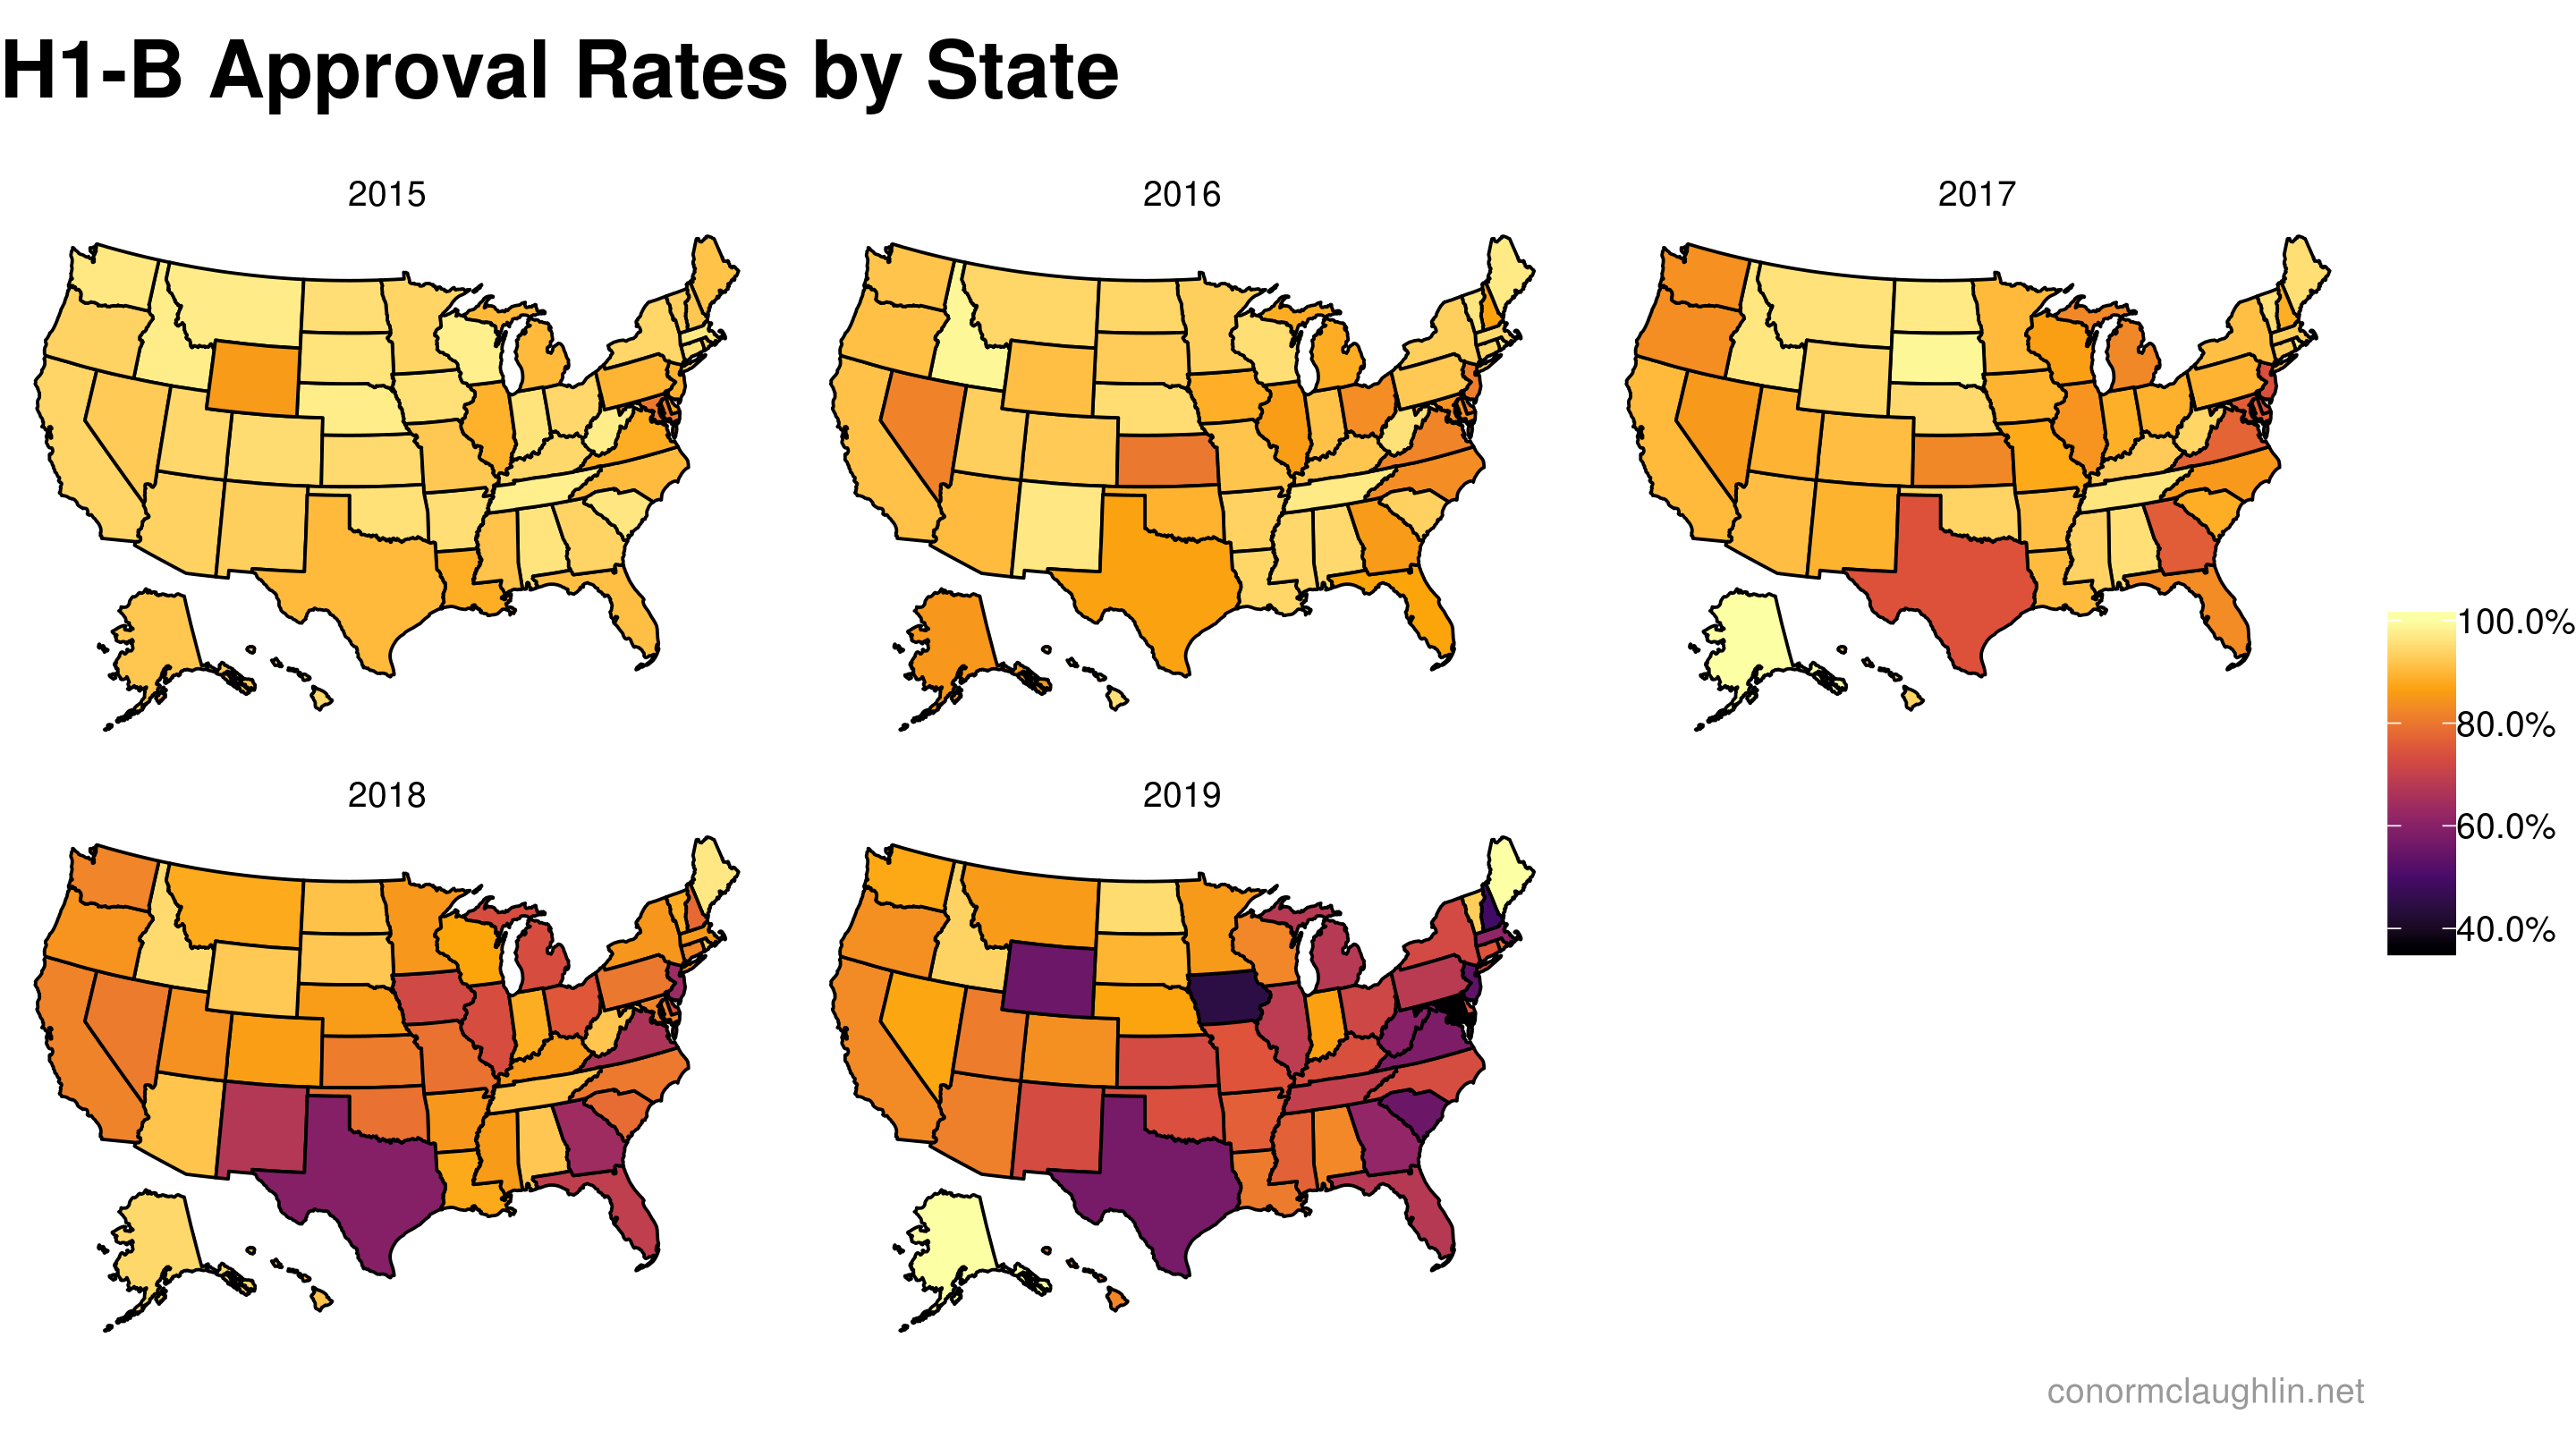
Mapping Approval Rates
Given that the USCIS data set has information on the location of each employer who sponsors a worker, I thought it might be interesting to map approval rates across the US and see if there are any geographic or regional trends which jump out. A few quick thoughts:
- Lower approval rates appear to impact the South and Mid-Atlantic most heavily
- Things look particularly rough for applicants in Maryland, Iowa, and Texas where approval rates are roughly a coin-flip, or worse
- The West exhibits relatively high approval rates throughout the years in the data set
- It was super fun to animate this chart (using gganimate to transition over years in the dataset)
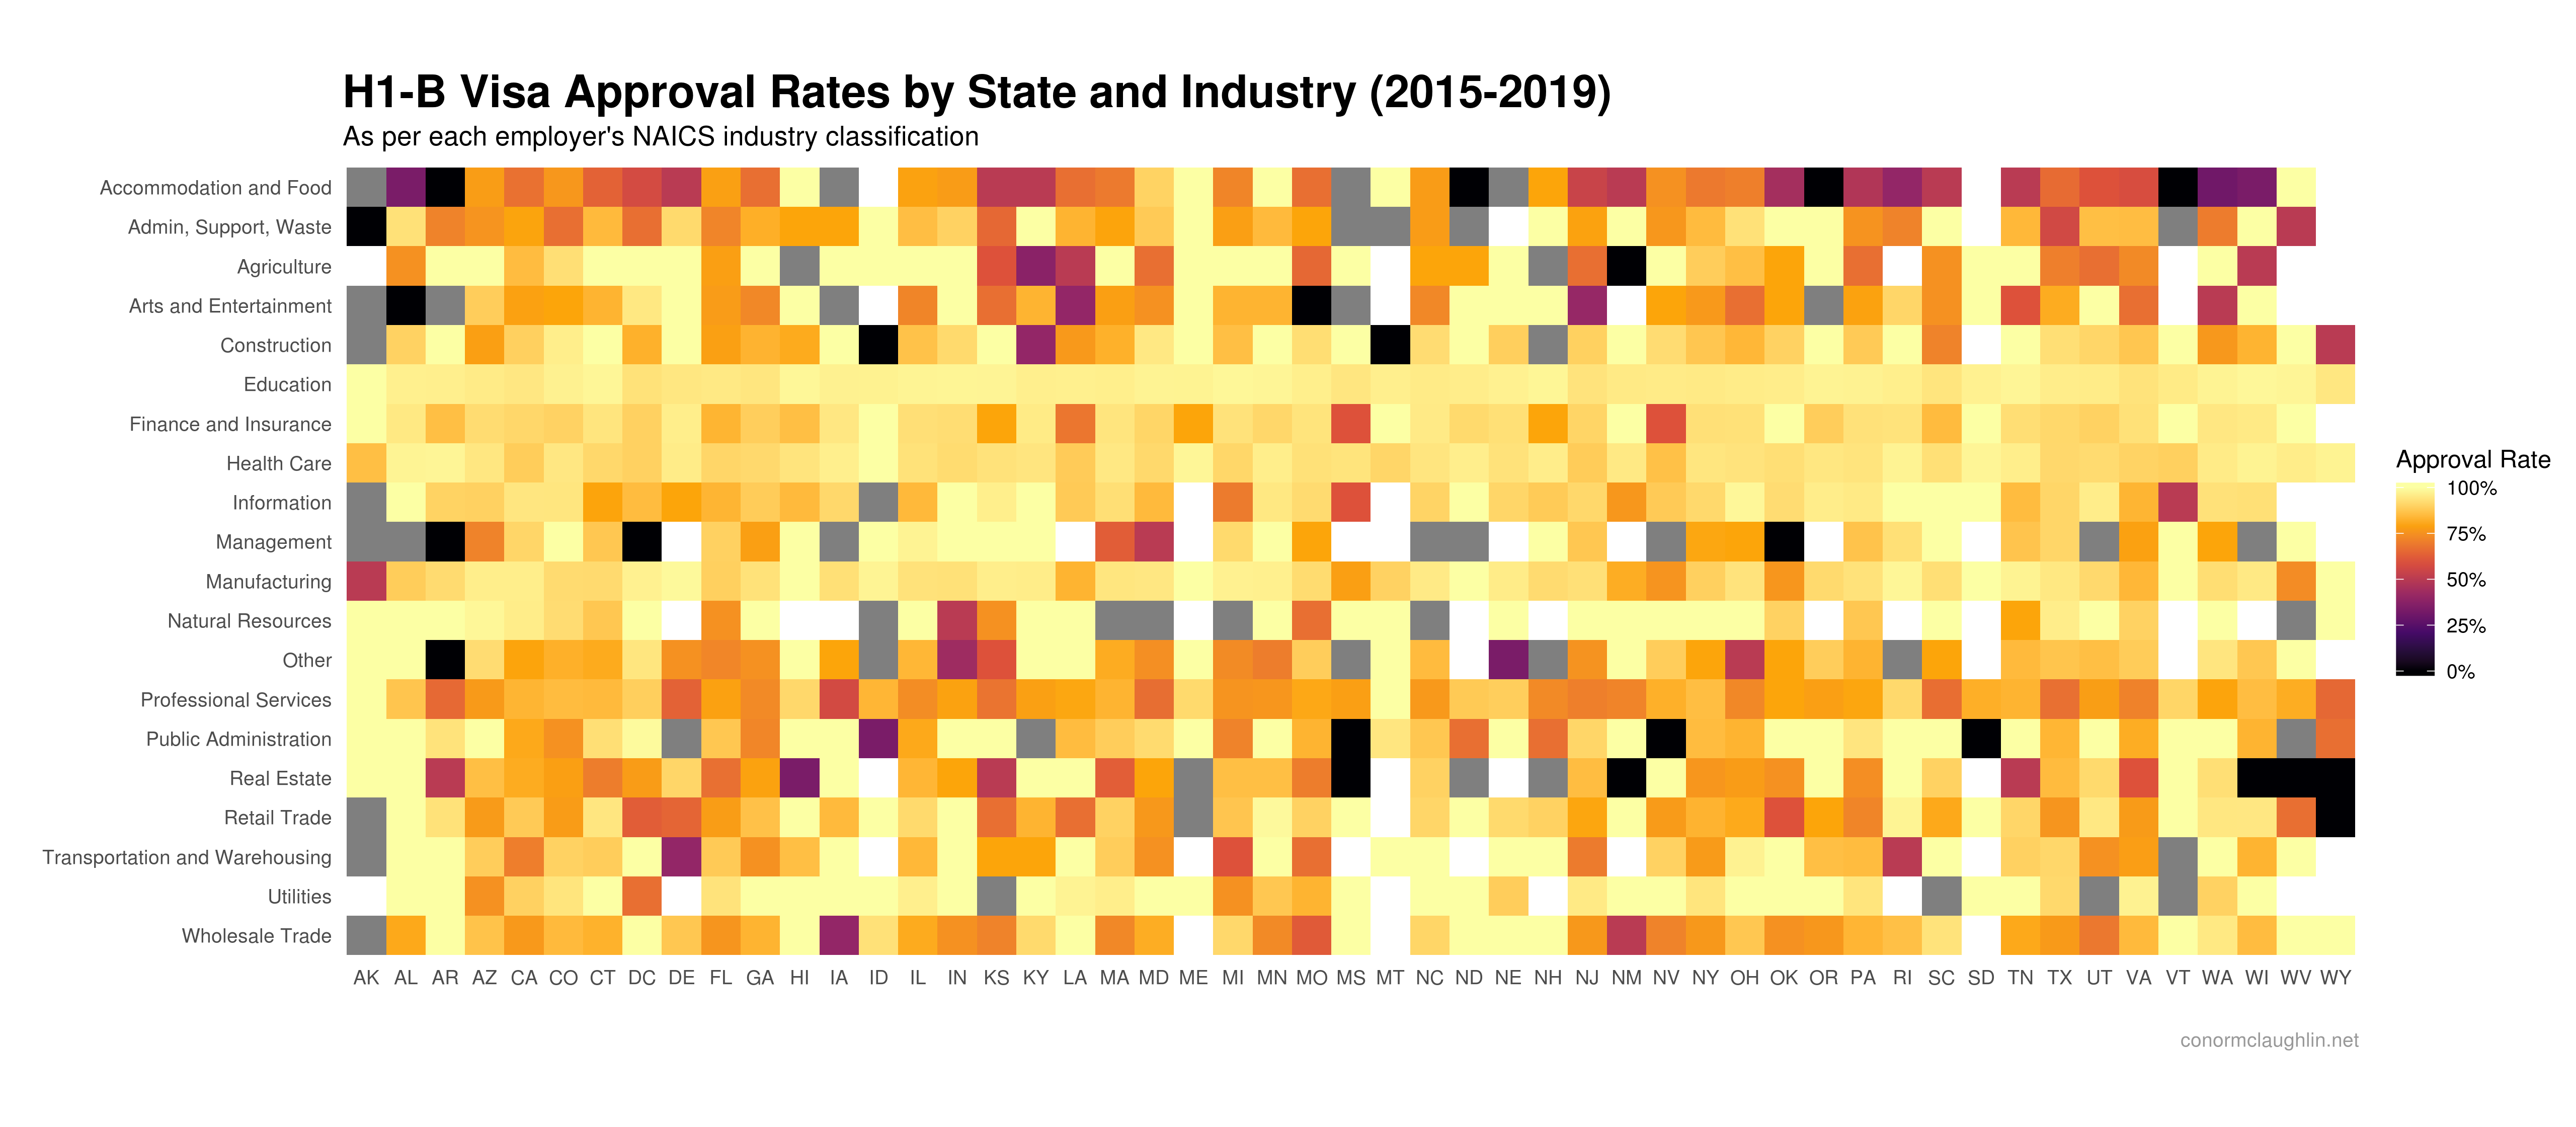
To further break down this data, I created a heatmap across all 50 states divided by industry, which I determined by probing the NAICS code of each employer. A few more thoughts on this data:
- Accommodation and Food is a tough industry to be in for anyone looking to secure a visa
- Real Estate is also particularly tough across the country
- Education has by far the highest approval rates, with Health Care, Manufacturing, Finance and Insurance, and Utilities bringing up the rest of the top five
Industries and Employers
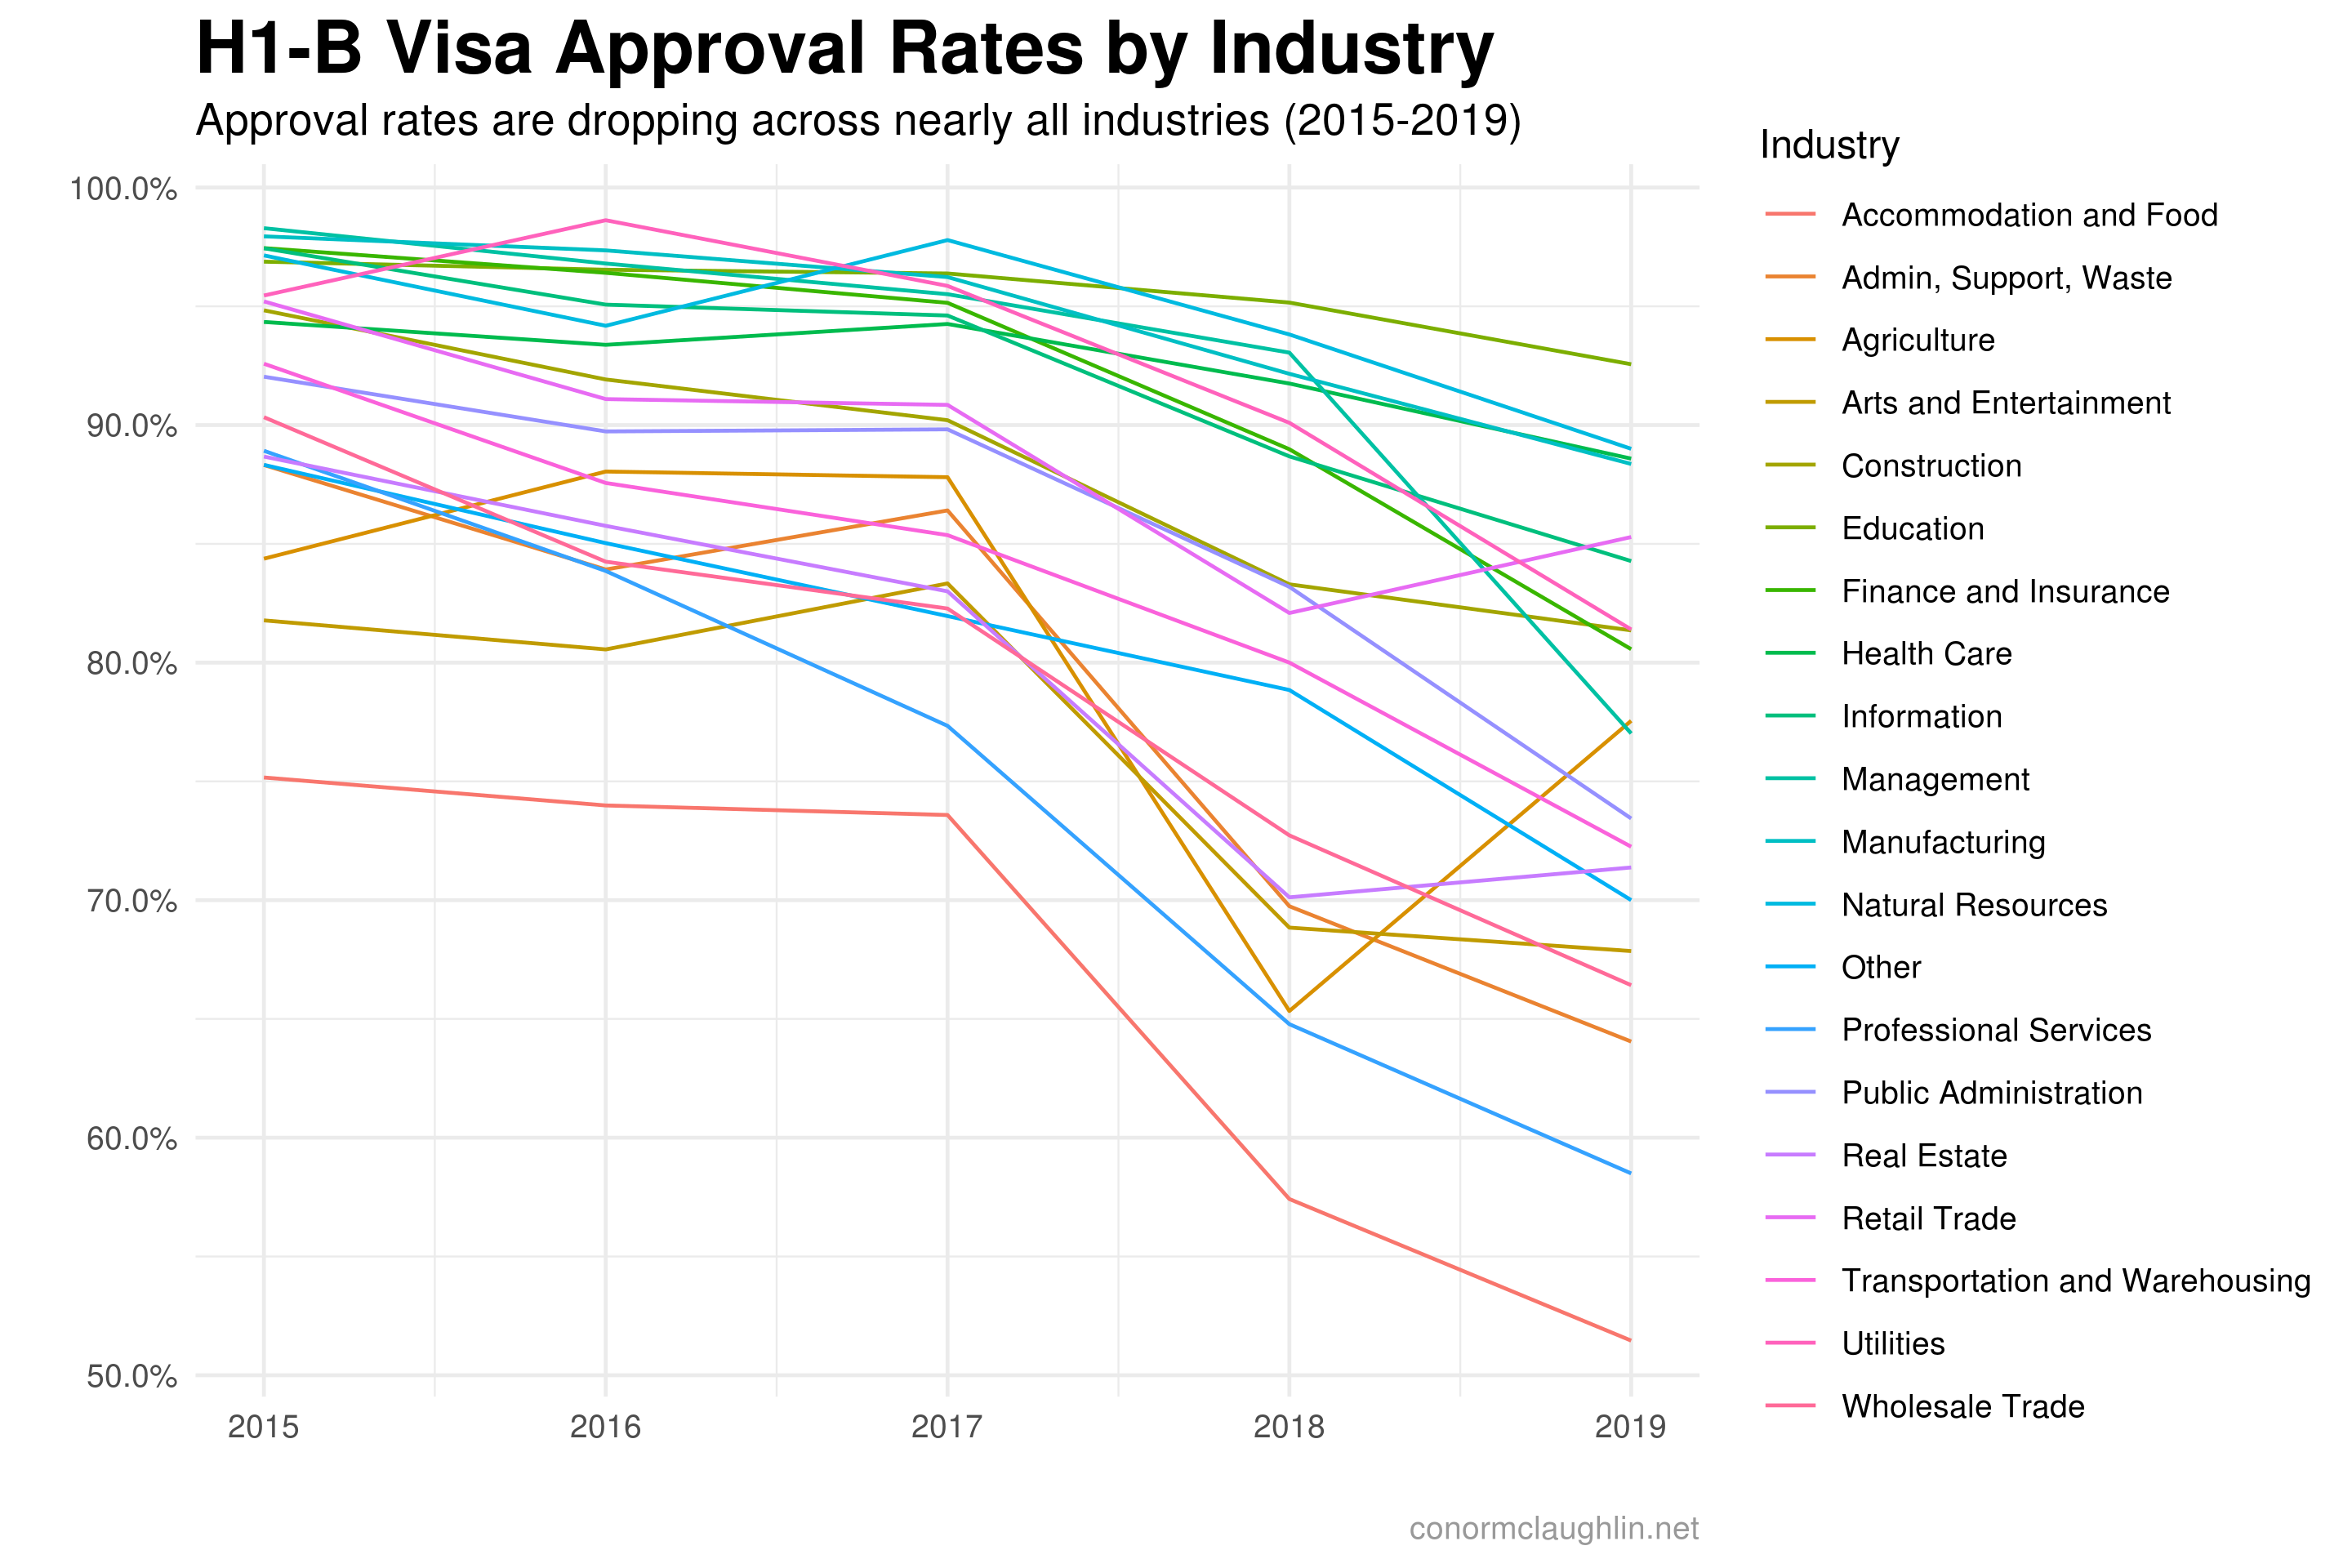
While it’s a little tough to differentiate between all the colors on the chart below, I think the big takeaway is that nearly all industries have exhibited a decline in visa approval rates that moves in parallel with the overall trend we observed earlier. Another interesting note is that “Professional Services” has the second-lowest visa approval rate of all industries, something we’ll look into a bit more in-depth in a second.
The scatterplot below charts volume of initial visa applications against initial visa approvals for the 2019 Fiscal Year. I find this chart particularly fascinating because it shows how active certain outsourcing and technical consulting firms are in the H1-B visa lottery process, but how their candidates are frequently not awarded visas.
- Most employers active in the H1-B lottery have only a few visa applicants, which is why the left axis of the chart is so dense
- To highlight top applicants, we’ve labeled the 20 companies with the most visa applicants thus far in FY19
- Tata Consulting jumps out as the worst offender sponsor, with 708 applicants recieving only 8 H1-B visas
- Wipro, Tech Mahindra, Congnizant, and Infosys are other employers known primarily as technology outsourcing firms which boast relatively low visa approval rates but sponsor hundreds of hopeful applicants each year. These “Professional Services” firms frequently seek to higher Indian employees to perform work at a lower cost than native American workers to increase profit margins and lower cost on human-heavy work
- Deloitte Consulting has a much higher number of H1-B visa applications than competitors Accenture and Ernst & Young (most of any employer thus far in FY19), but secures approvals on fewer of those applicants than the other firms do
- High-tech companies such as Intel, Microsoft, Facebook, etc. submit a relatively high number of sponsored applications while securing very high approval rates. It’s unclear whether or not this effective is because the applicants are particularly high quality, or because it is easier for these prestigious companies to secure the visa approval on the strength of their reputations, but it’s clear that applicants at these companies have a leg up on securing visas upon sponsorship

I’ll close with a trend chart of initial visa approval rates for applicants sponsored by a FAANG company (Facebook, Apple, Amazon, Netflix, and Google). As you might expect from my comments in the previous section, these companies exhibit extremely high visa approval rates, which I think is fair to chalk up to a high baseline in terms of employee competitiveness as well as a desire on behalf of these companies to hoover up the best technical talent across the world and bring it to Silicon Valley, which the government appears to endorse.
