For a longtime Nationals fan, watching the Playoffs this season has been a funny mix of nostalgia, jealousy, and happiness. Nostalgic for our 2019 run through the NL, jealous of the Braves and Dodgers for their success this season, and happy for longtime Nats Max Scherzer and Trea Turner, who have played such an integral role in Dodgers’ success after their blockbuster acquisition by trade.
Speaking of that deal… it was especially fun to be at the Dodgers vs Brewers Wild Card game and get to see Juan Soto attending in person, making the cross-country flight to be able to see his old teammates play a crucial elimination game!
Max Scherzer and Trea Turner celebrate with old teammate Juan Soto 💙 pic.twitter.com/F3V2unPZFv
— B/R Walk-Off (@BRWalkoff) October 7, 2021
To me, Juan showing up at the game to support his old teammates is just a small, but instructive, example of the kind of person he is off the field - loyal, supportive, and hoping for some excitement! In many ways, quite like Giannis Antetokounmpo, another giant of his realm…
So - with all that said, let’s pivot away from talking about Juan Soto the baseball fan, to talking about Juan Soto the baseball player! I’m not sure that enough people have truly appreciated the greatness of Soto’s 2021 season (particularly the second half), so I thought it might be fun to put together some visualizations which show what a tremendous player he is.
Visualizing Chase Rate
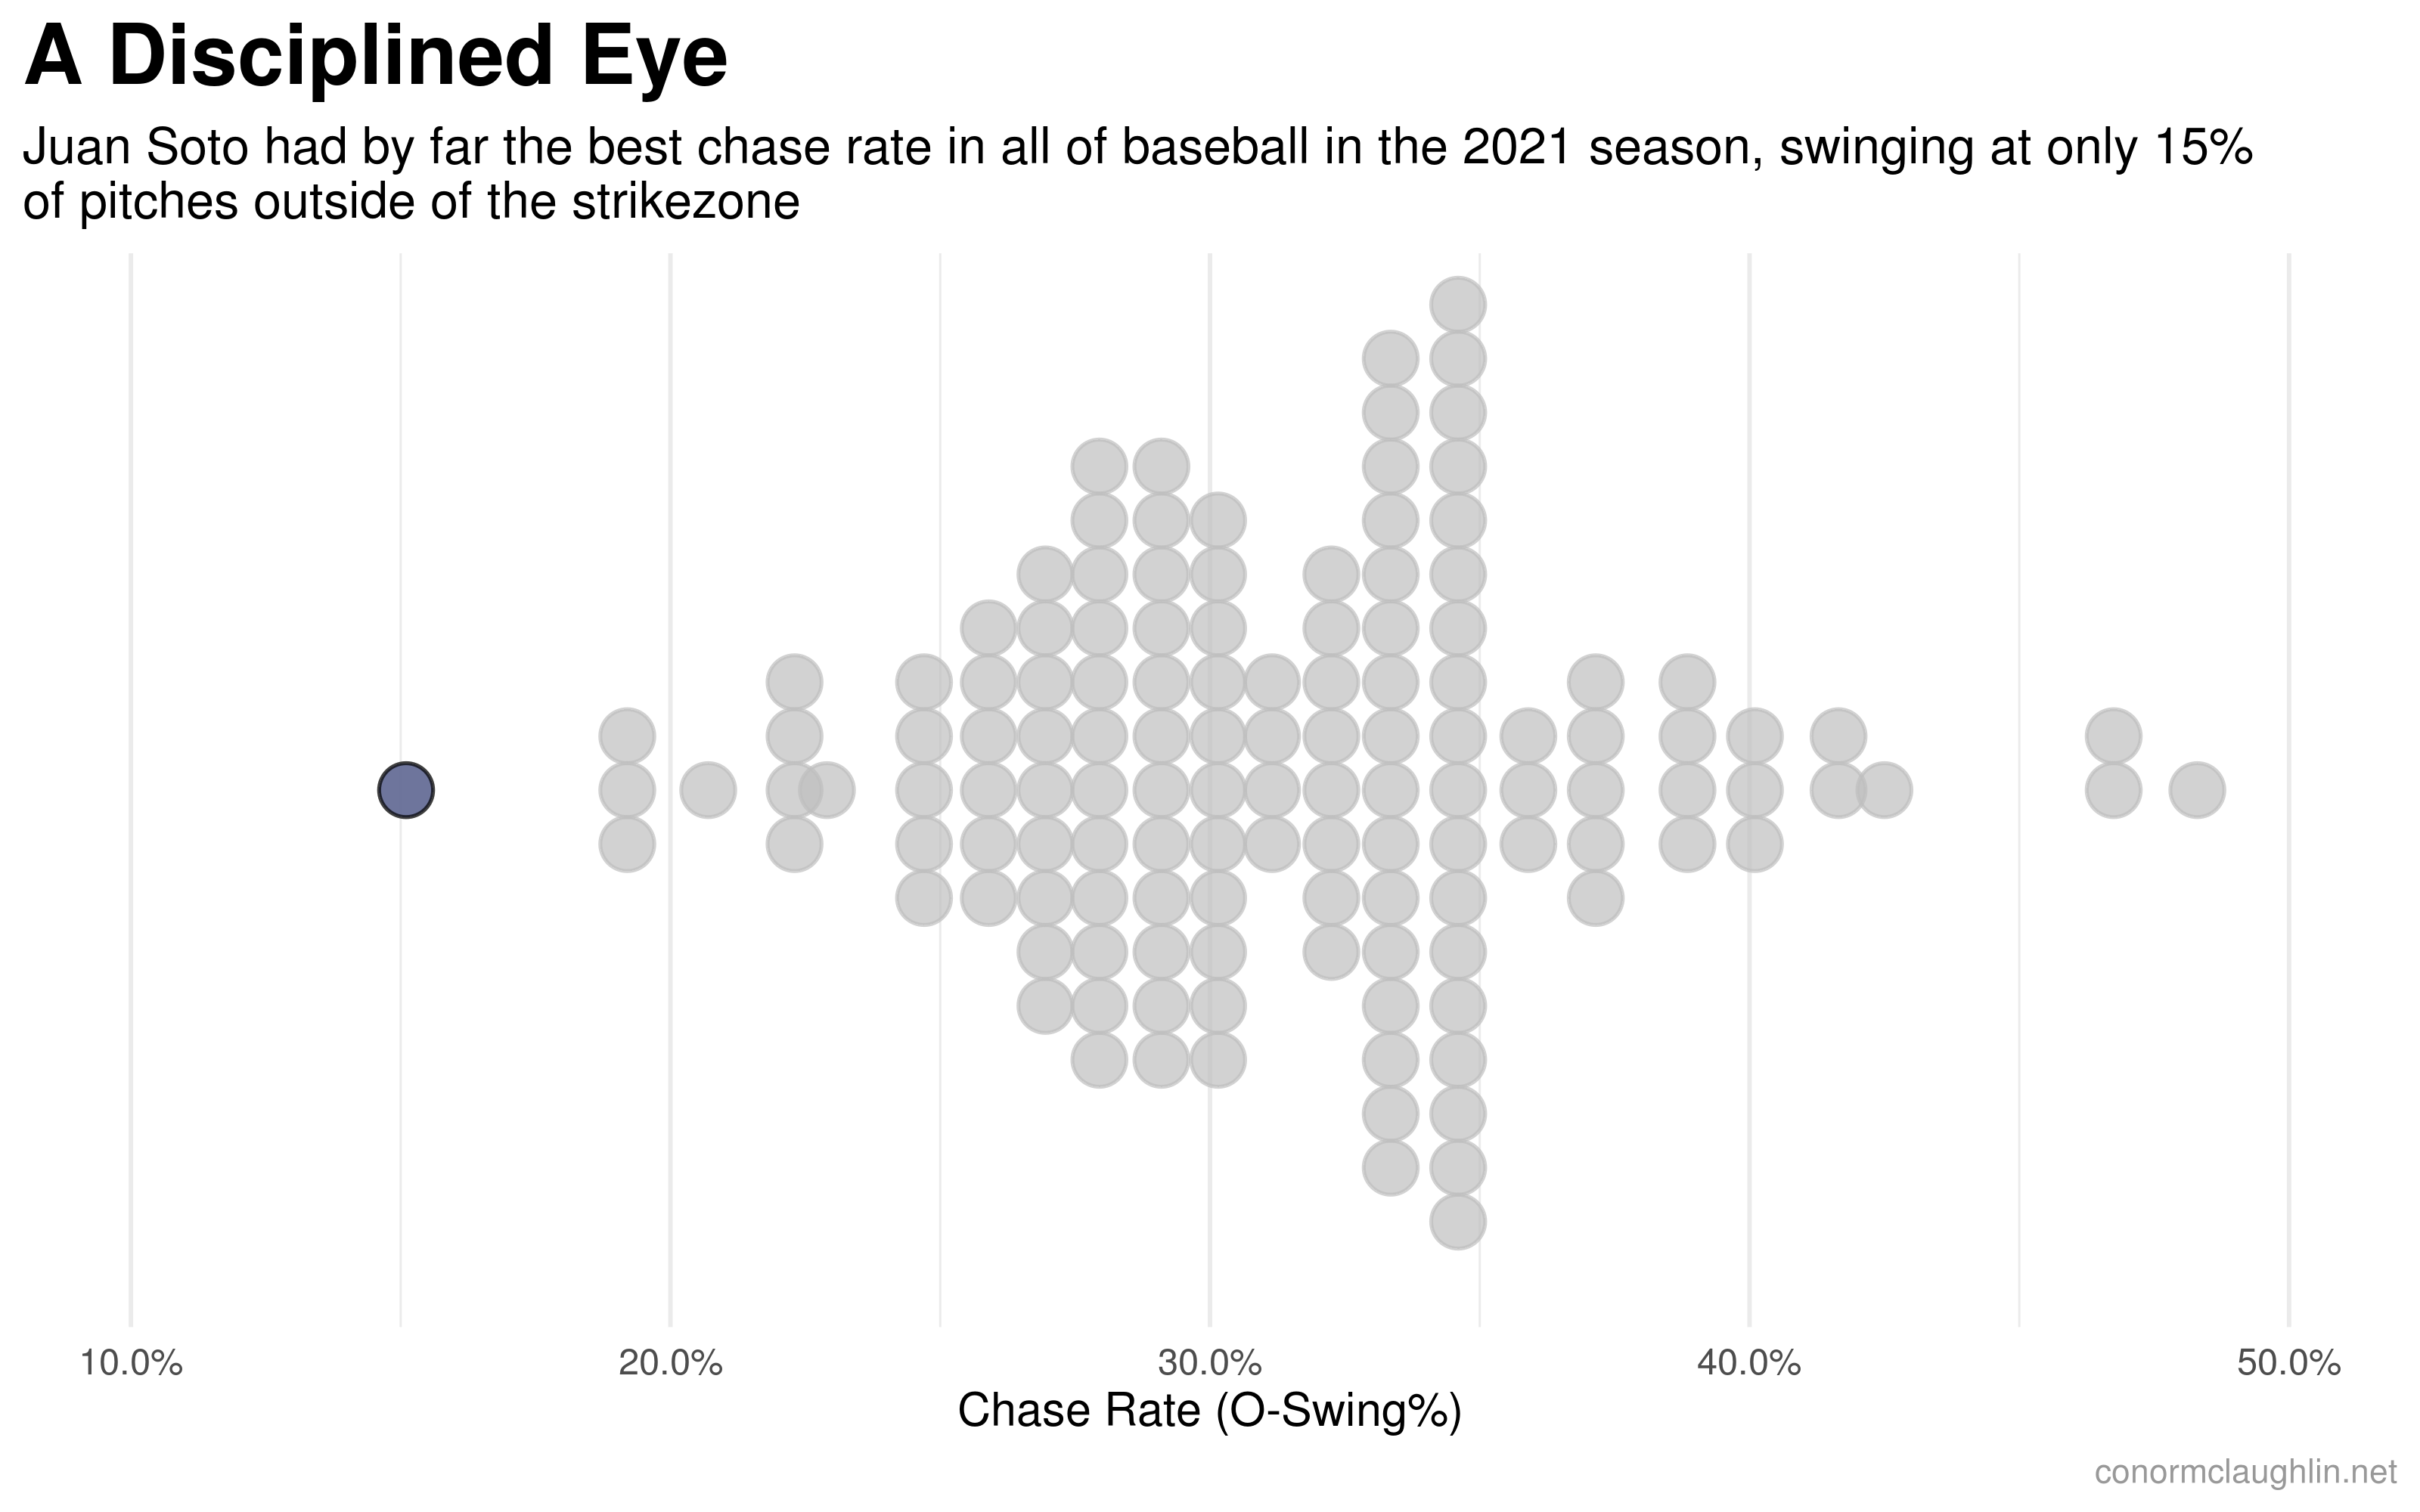
To start off, let’s look at how incredibly disciplined he was at the plate this season…

Visualizing Walk and Strikeout Rate
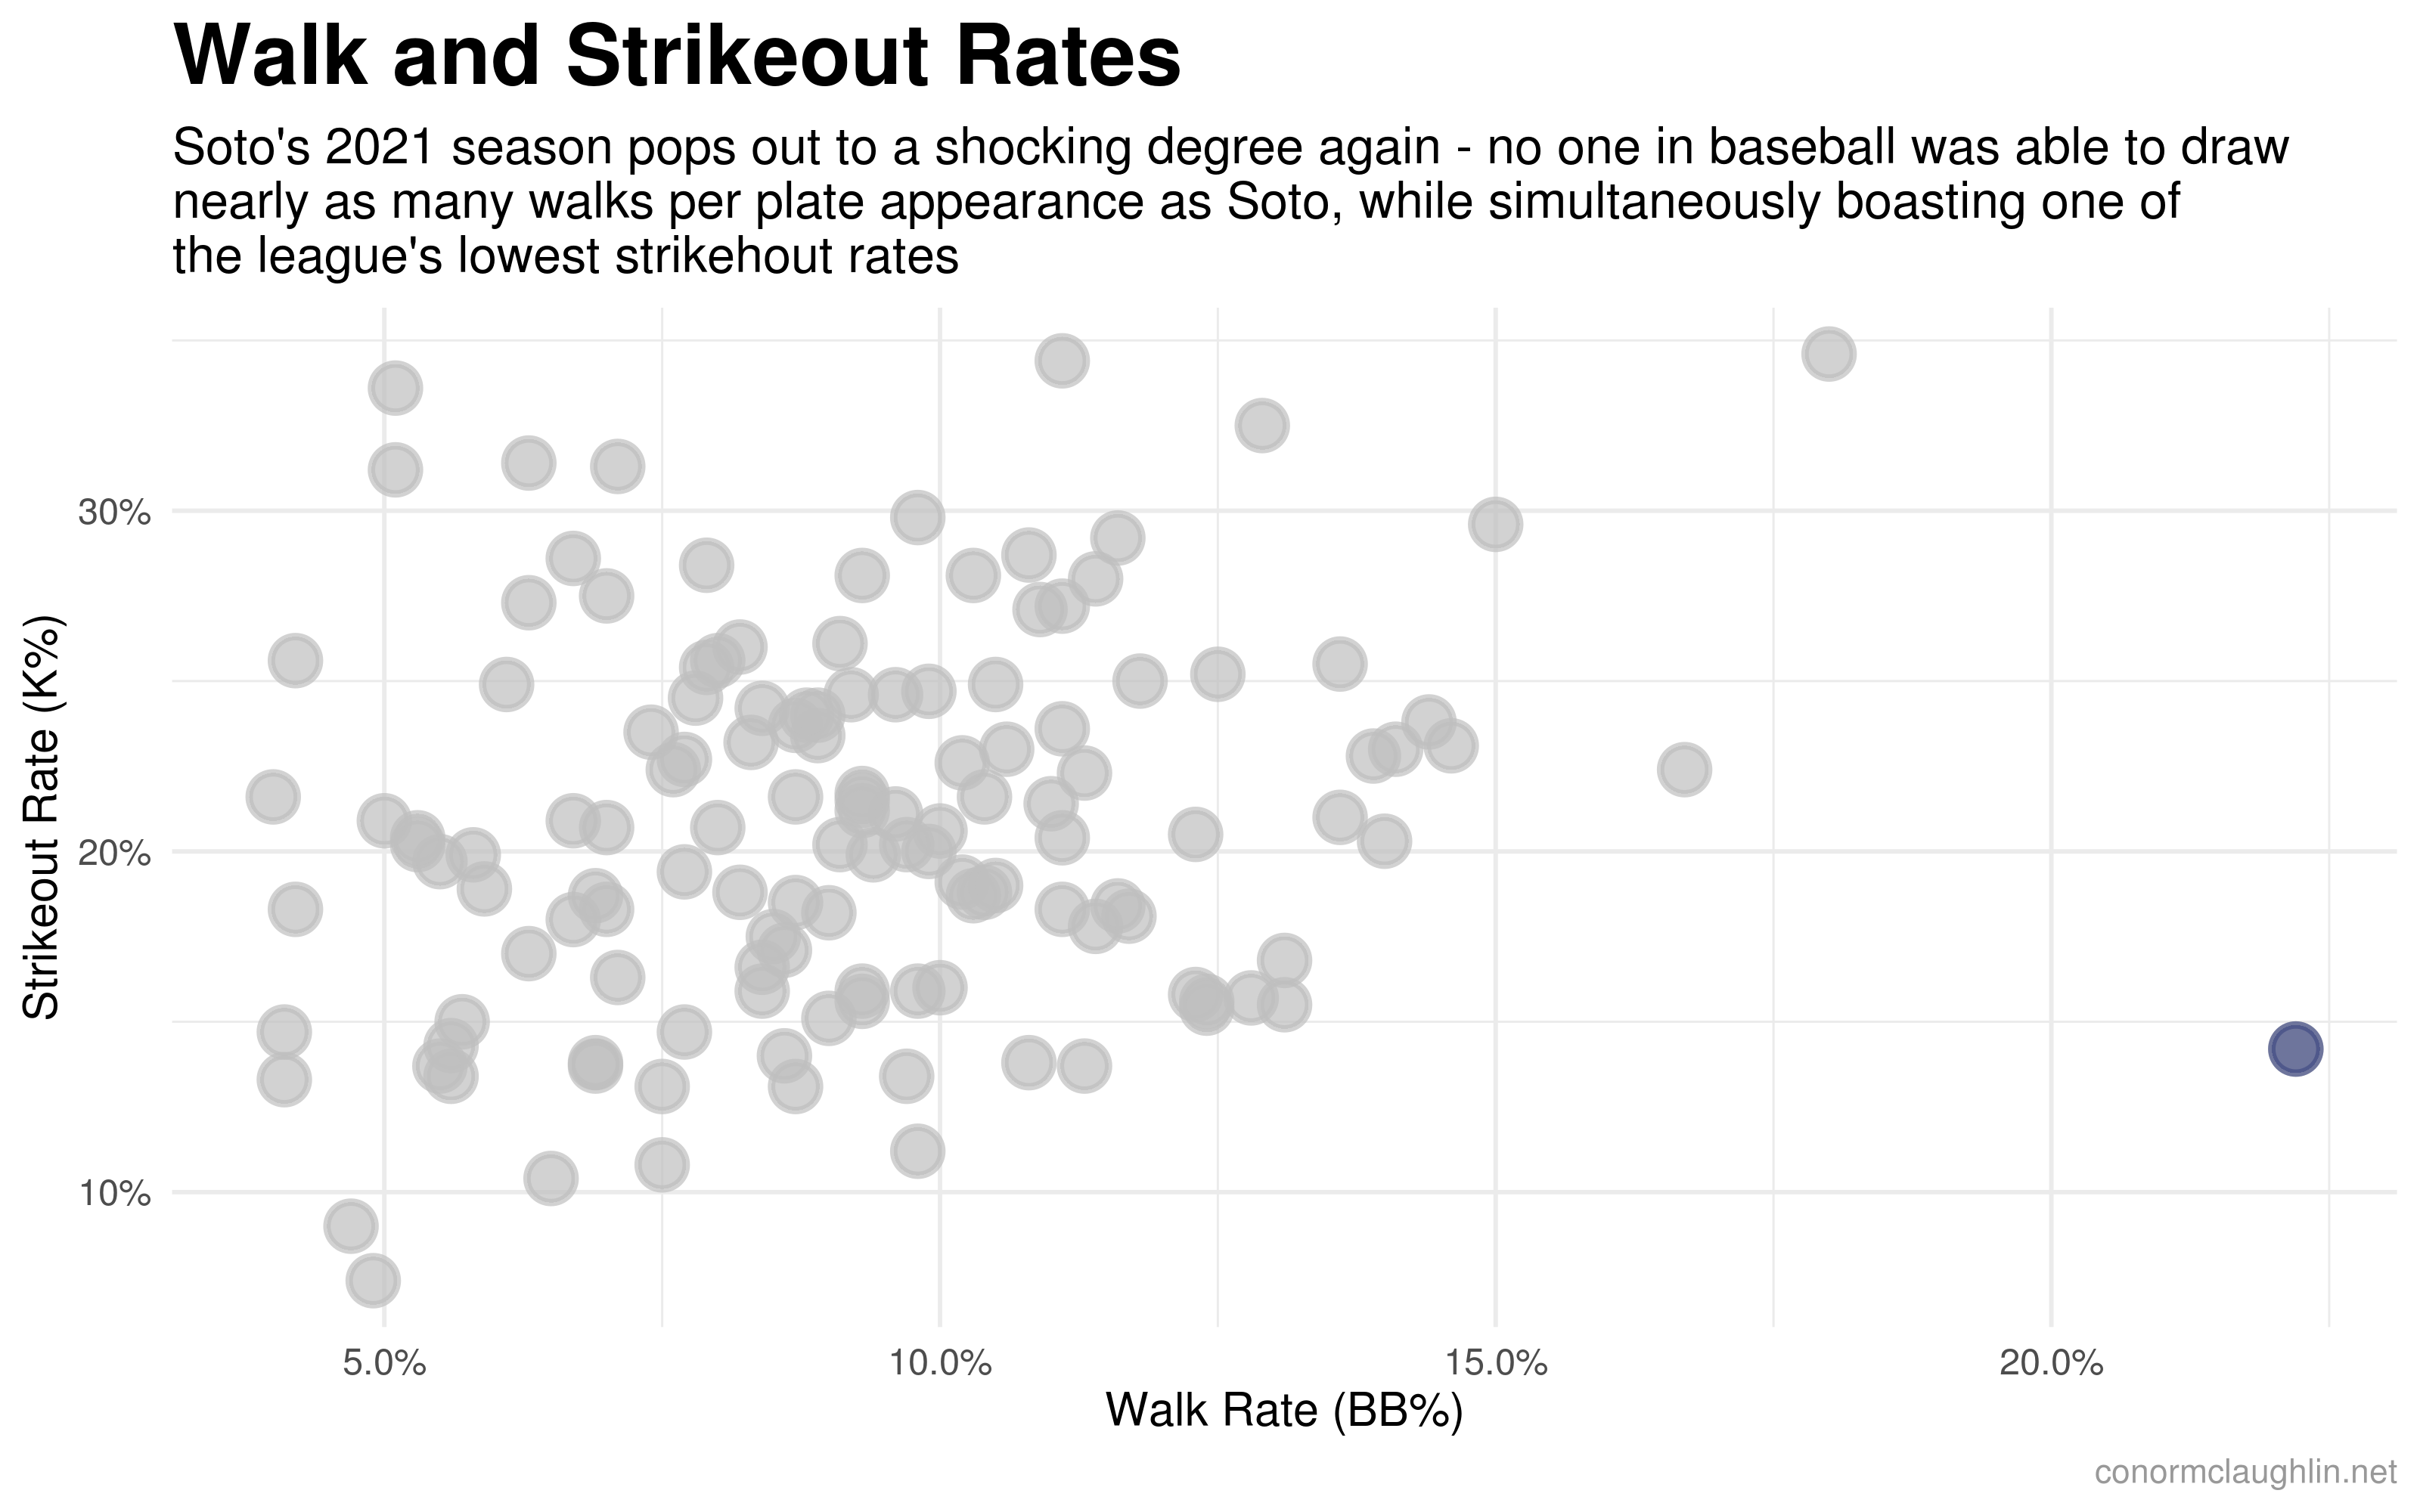
Soto’s unique ability let balls go without chasing translates directly into a Walk Rate which led all of Major League Baseball, with over 20% of his plate appearances ending in a free base. And contrary to other walk-happy stars like Joey Gallo, who offset their walks with a tremendous number of strikeouts (playing right into the three-true-outcomes mold), Soto also rarely strikes out, making him the only qualified hitter in baseball with a BB/K ratio over one - with his standing at 1.56!

Visualizing OBP and Slugging
An incredibly high walk rate naturally does great things for one’s on-base percentage, where Soto also led Major League Baseball. He coupled that with strong power, which particularly took off after the Home Run Derby, in a rare case of the Derby seemingly “igniting” a second-half resurgence, rather than the typical “come down to earth”.
Below are Soto’s first and second half splits for the season - look at the power numbers rising late in the year!

Visualizing Relative Performance Across a Variety of Metrics
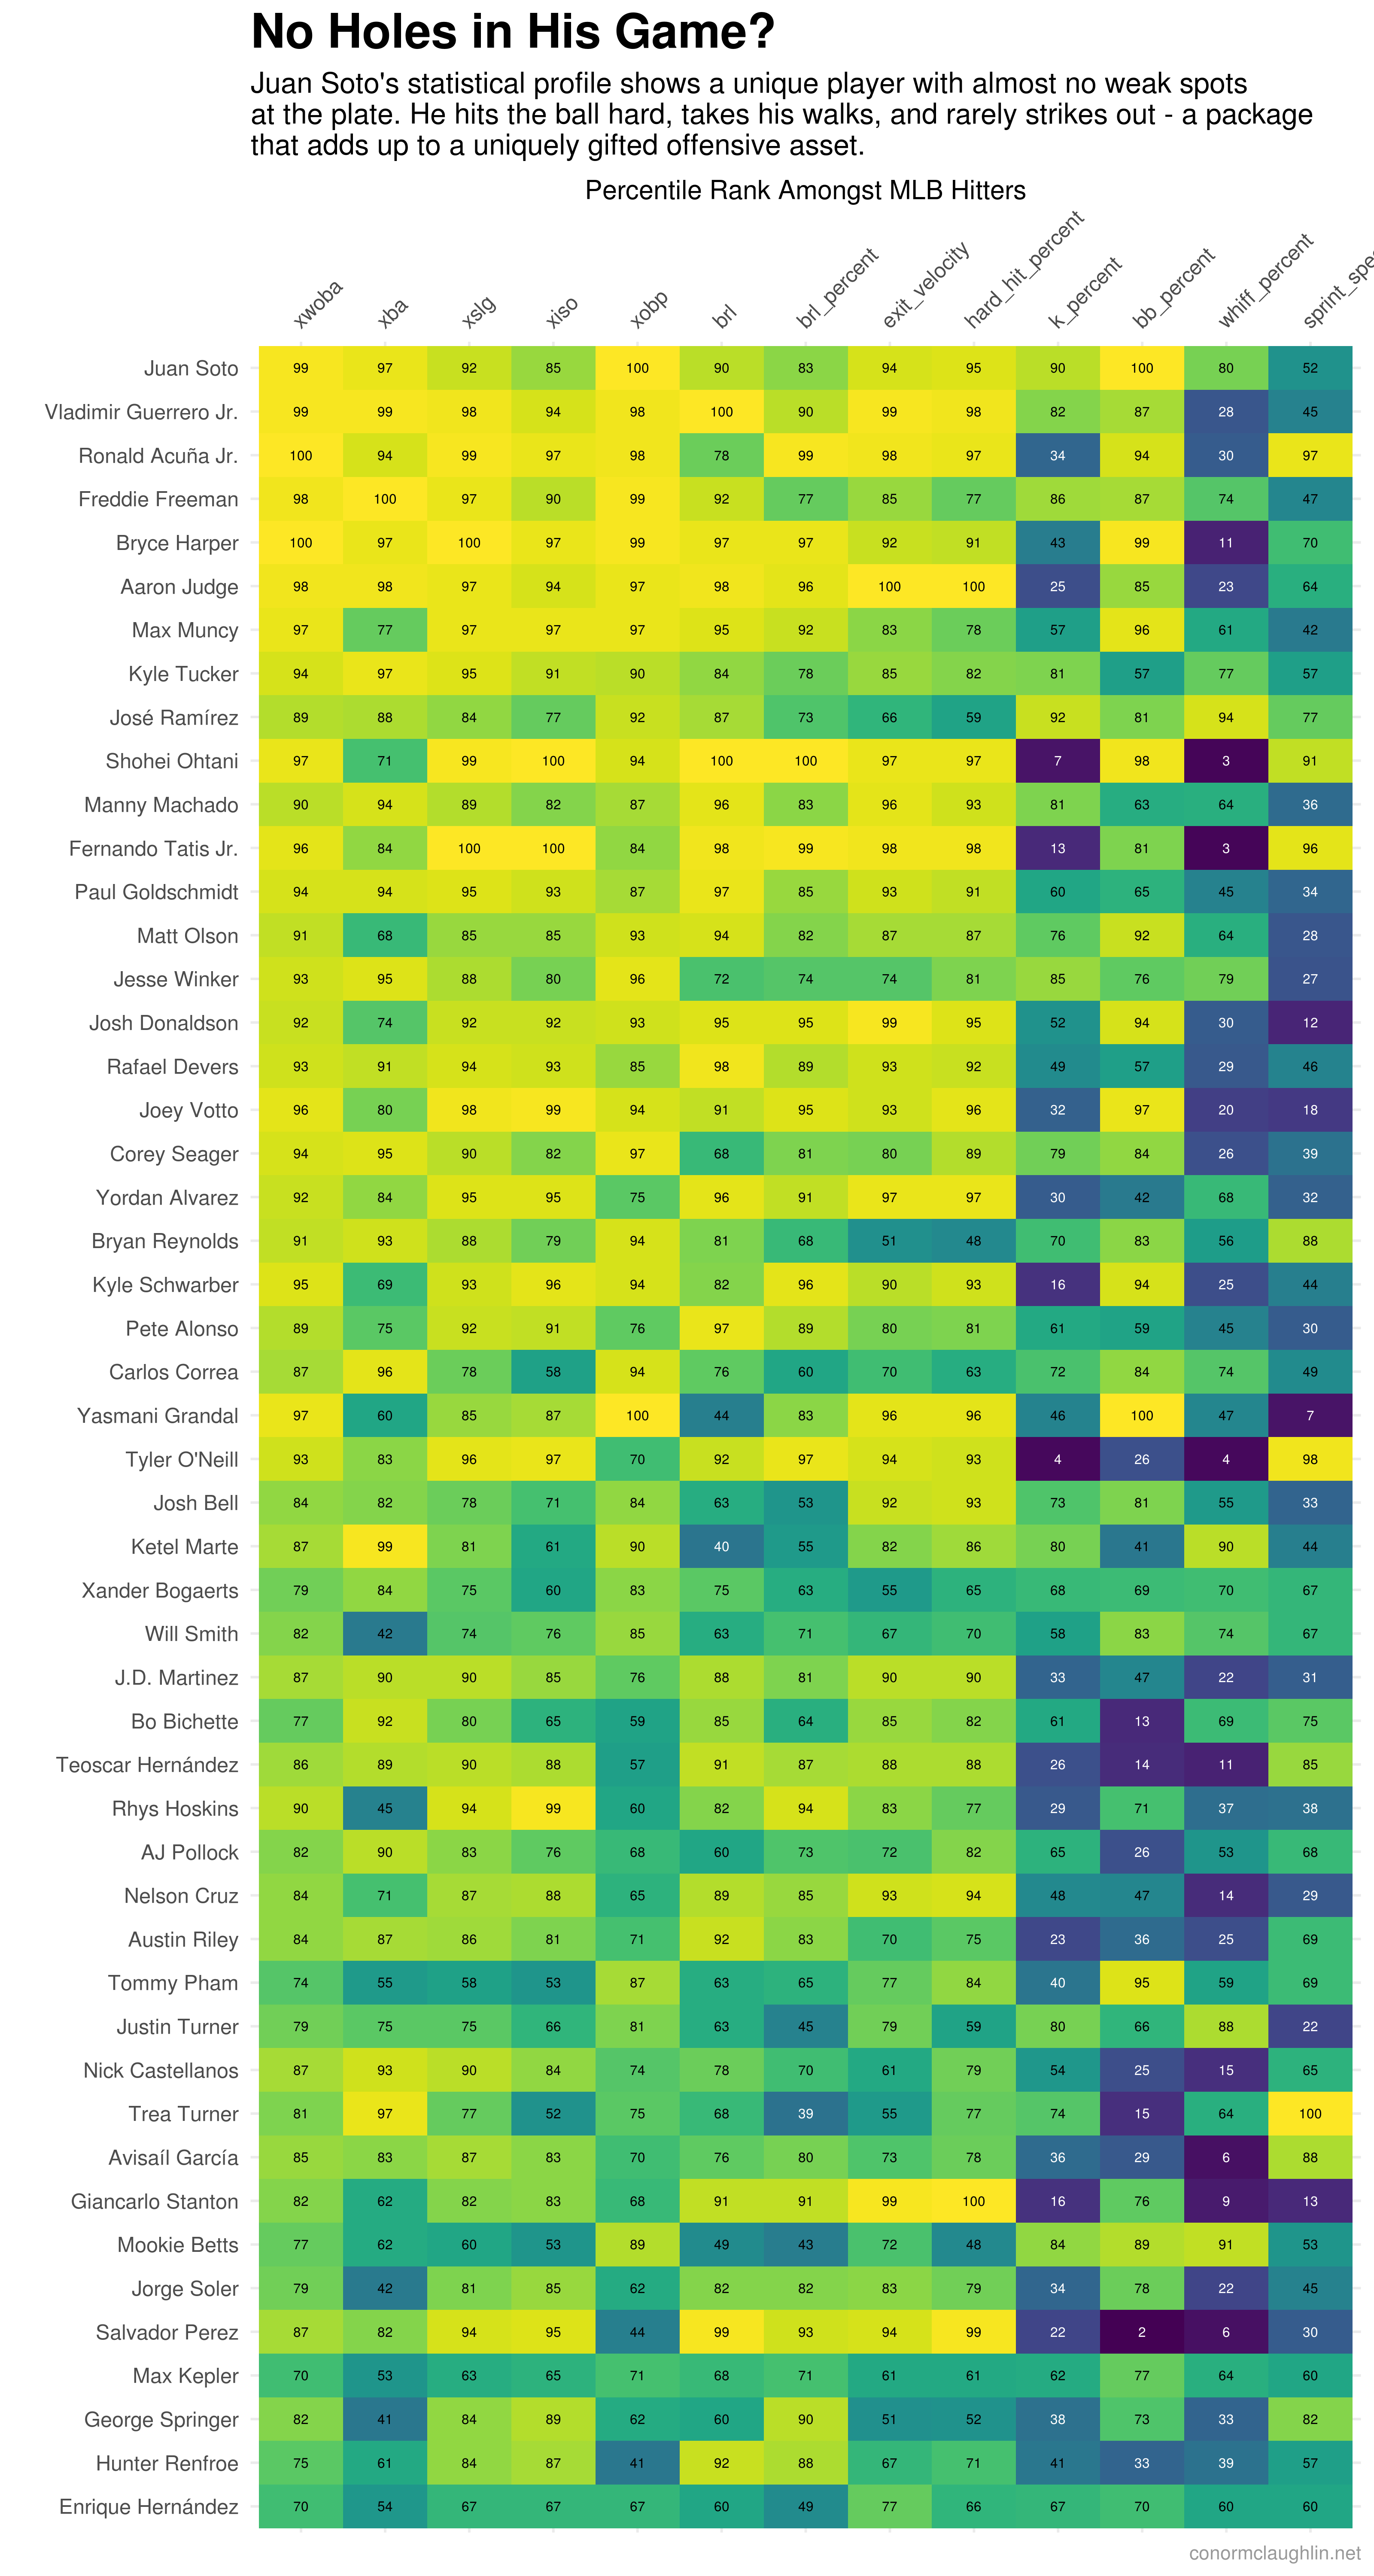
Finally, we’ll close by looking at how Soto performed against the rest of the league on a broad spectrum of indicators. This dataset, powered by Statcast’s Rankings Leaderboard, is especially interesting to me because it shows that most players in baseball, even really good ones, end up making some sacrifices in order to maximize their overall production at the plate. Some classic archteypes are the big slugger who still strikes out a lot (Aaron Judge, Shohei Ohtani), or the hard hitters who don’t walk enough (Trea Turner).
I’ve taken the top 50 players in the league and presented their rankings across these indicators as a heatmap, so that these areas of strength and weakness can be easily visualized. Players are sorted in descending order of cumulative percentile score - so in this way, I think it’s fair to say that Juan Soto was the most well-rounded offensive player in baseball this past season!
