Growing up on the East Coast, I never thought much about water. And why would anyone? With abundant rivers, lakes, and reservoirs, water is cheap and easy to access.
Since moving out West, it’s been interesting to see a world in which the baseline is almost fully opposite: water is increasingly rare, expensive, and difficult to acquire.
While this winter’s parade of rain and snow storms should provide a brief respite from the drought conditions plaguing the region, I have no doubt that the overarching trend of aridification in the West will resume and potentially even intensify over the coming decades.
Colorado River Basin
With that background in mind, I have become more and more interested the health of the Colorado River Basin (CRB). This watershed is absolutely critical to the West, as it is the primary freshwater source for forty million people and for agriculture across the Southwest - with water users from seven different states and the country of Mexico.

Unfortunately for us all, the CRB has a dirty little secret, which we are only just starting to reconcile with: it doesn’t have enough water to sustain the current levels of use.
With water levels rapidly declining in Lakes Mead and Powell, and states unable to agree on a framework to reduce their collective consumption, the CRB is now under the control of the Bureau of Reclamation of the Federal Government, which is looking to reduce water use by at least two million acre-feet per year.
Water Usage Trends
To better understand the debate on CRB water uses and improve my grasp on the impact of future policies affecting the Basin, I decided to do a deep dive into the primary uses of water.
A publication by the USGS, titled “Estimates of Water Use and Trends in the Colorado River Basin, Southwestern United States, 1985-2010” served as an incredibly useful guide, breaking down use over time by state and category (ie. irrigation, livestock, public supply).
I’ve created three charts which seek to summarize the latest data from the report (which, you should note, is from 2010) at a very high level. While there are tons of interesting datapoints in the report, I noticed three main trends, which I really wanted to make obvious through my visualizations:
- Arizona and Colorado are the biggest consumers of water from the CRB, and after counting in water exports (classified as “Interbasin Transfers”), California comes in third. The remaining four states each consume far less
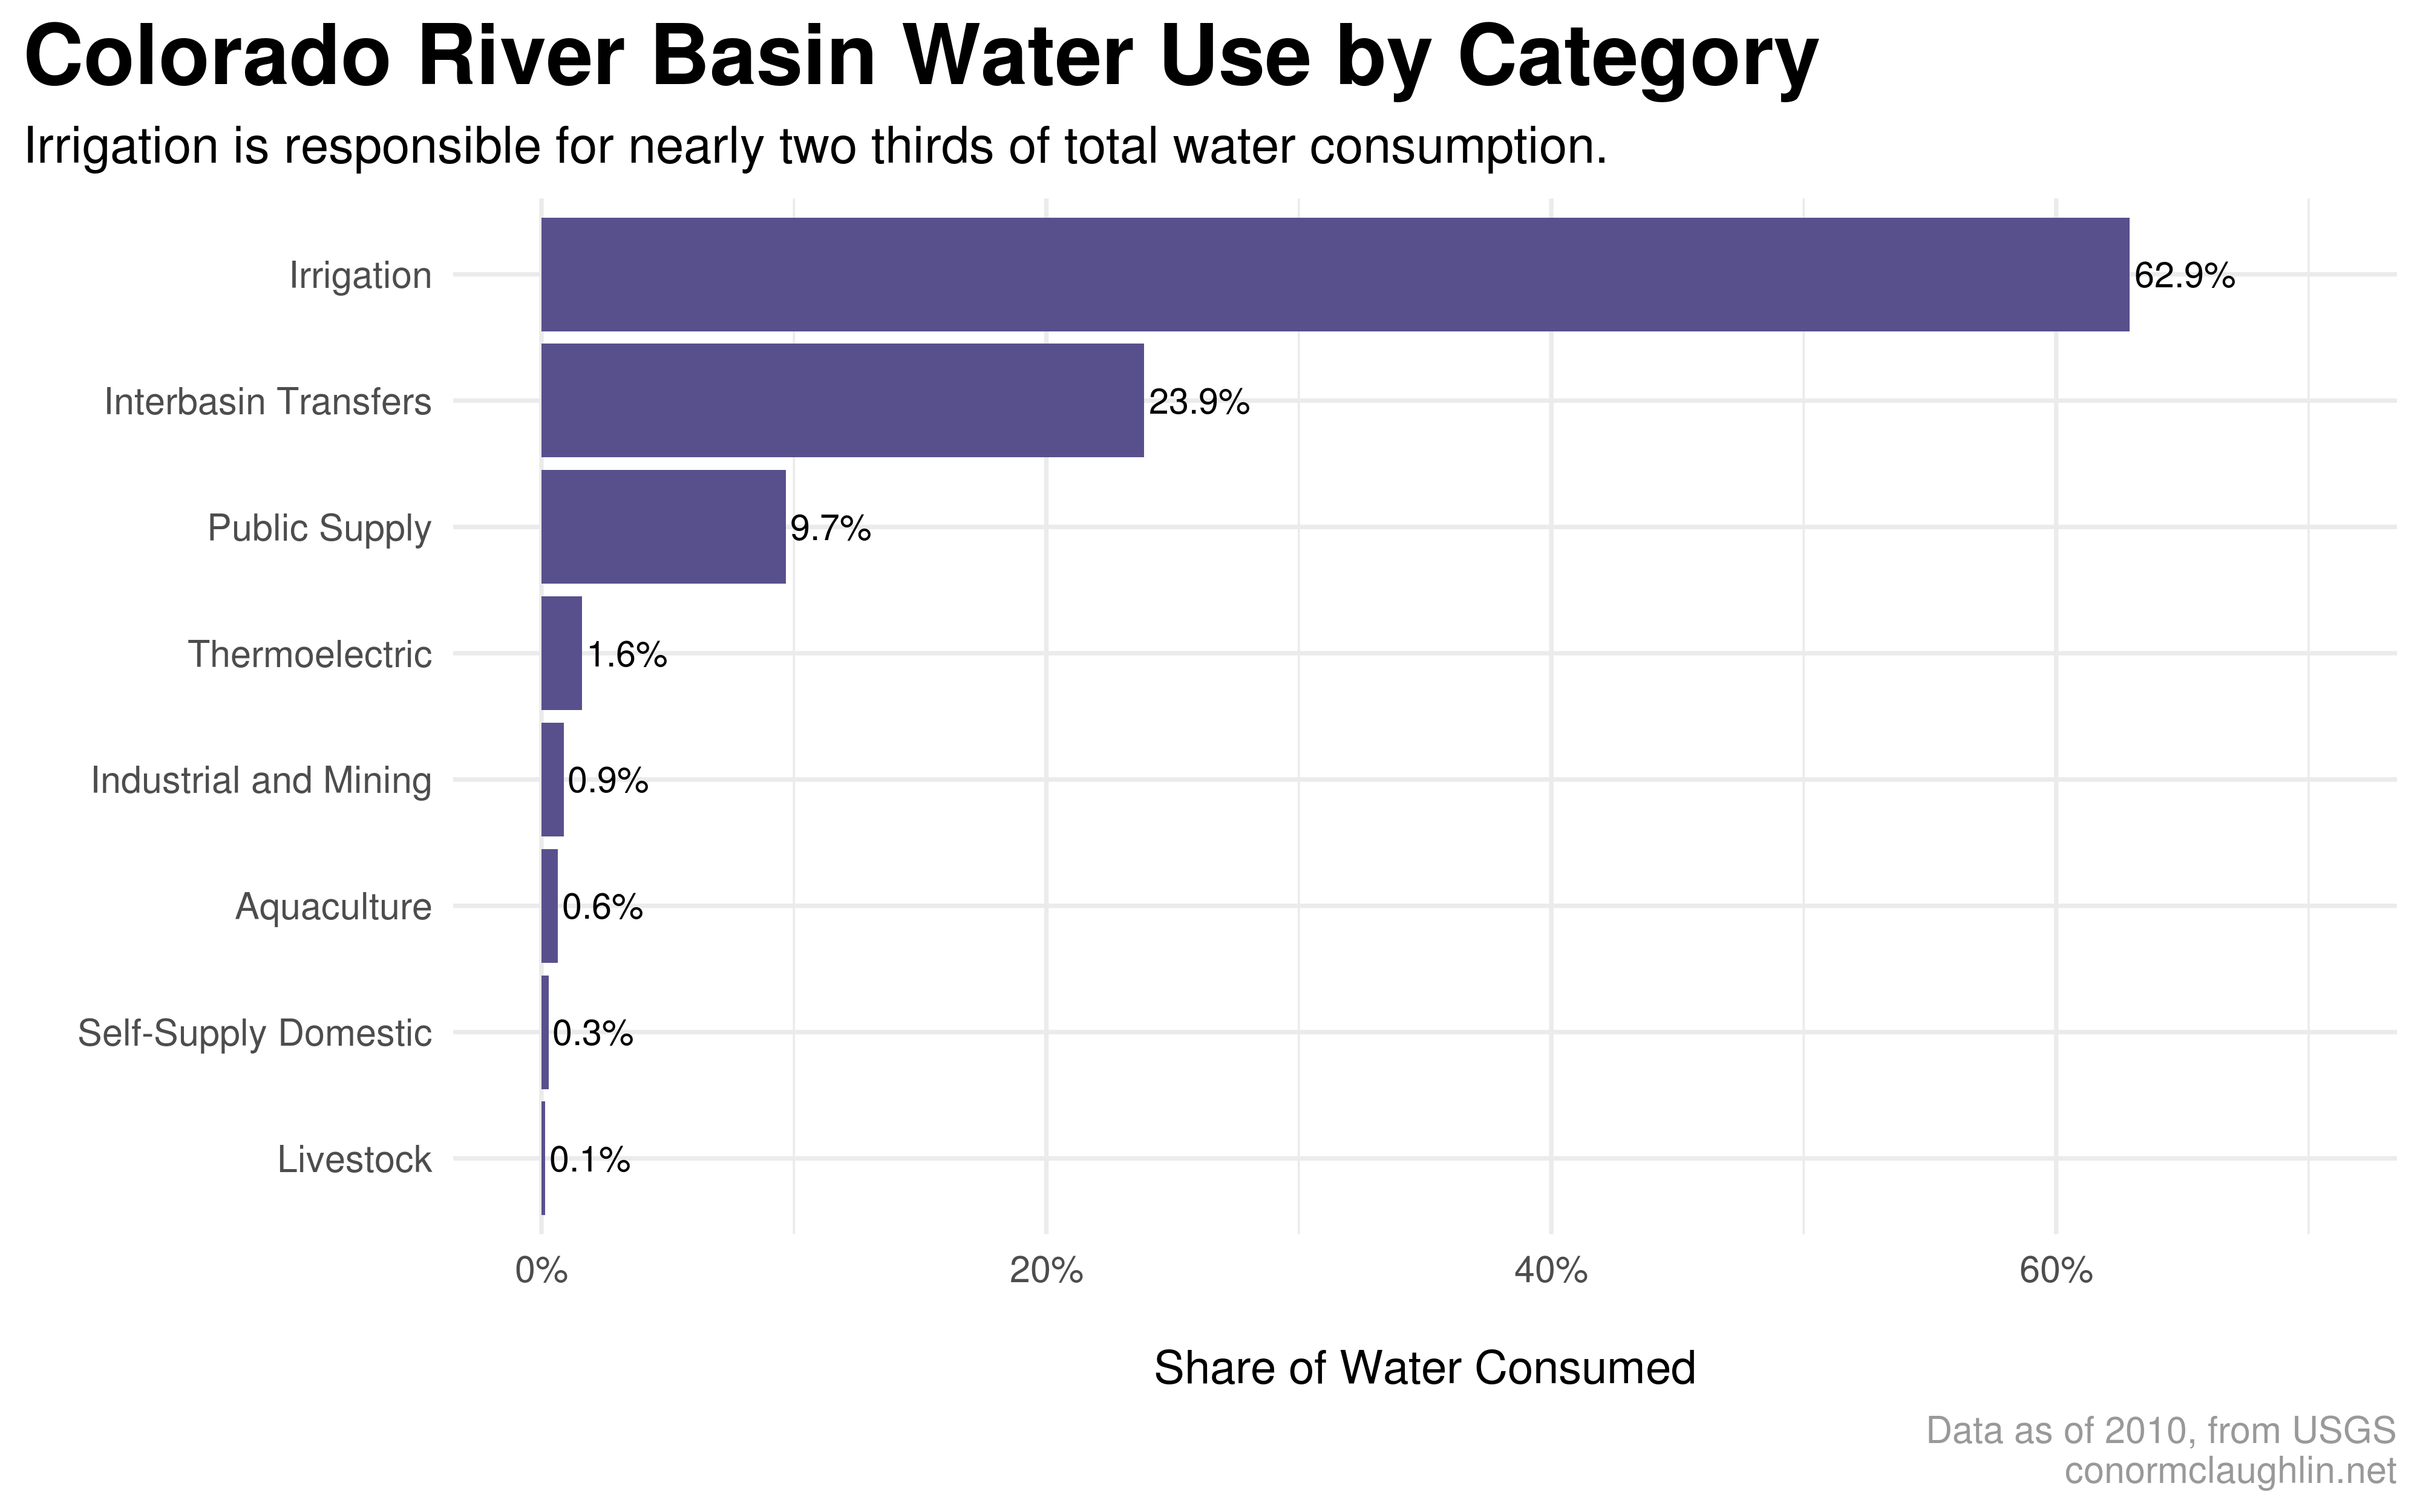
- Irrigation is the largest use of water from the CRB by far - representing roughly two-thirds of total consumption
- Personal use remains a much smaller user of water than agriculture, and therefore, a much smaller lever for future improvements. Therefore, while residential reforms are helpful (planting of local plants, low-flow toilets, etc.), the opportunity to make large-scale reductions in water use resides in the agriculture space. As such, I think debate on reduced water use should start with the question of “while we can use CRB water to irrigate farms in the desert, should we?”
Colorado Rider Water Use by State

Colorado River Water Use by Category
Colorado River Water Use Breakdown by State and Category
