Pythagorean record is one of those useful rules-of-thumb that every veteran baseball fan knows to consult when there’s an anomaly in the standings.
“Well, you see, the Mariners and the Rangers both have 74 wins - but the Rangers have a +173 run differential, and Seattle’s only at +102… I’d expect Texas to pull ahead.”
Regression to the mean is an incredibly powerful factor in sports, and Pythagorean record helps capture it much better than pure Win/Loss record, which is subject to the many idiosyncrasies of the sport and tends to be less predictive of future outcomes.
NL Standings
Why do I bring this up? An excellent question.
Allow me to direct you towards the National League standings as of 2023-08-28, which shows the San Diego Padres sitting in fourth place in the NL West, at 62-70 but with a shocking +56 run differential.
Looking at the rest of the league only confirms what an anomaly this Padres season has been - with a Pythagorean record (shown in the X-W/L column) of 72-60, they have lost a full ten games more than we would “expect” - the largest difference between actual and expected outcomes for any team in the NL.

Isolating Root Causes
Given how significant this divergence is - with the runs figures saying the Padres “should” be a wild card team - I thought it would be fun to do some digging and see if I could find a way to explain why the Padres’ actual win/loss record has underperformed so markedly.
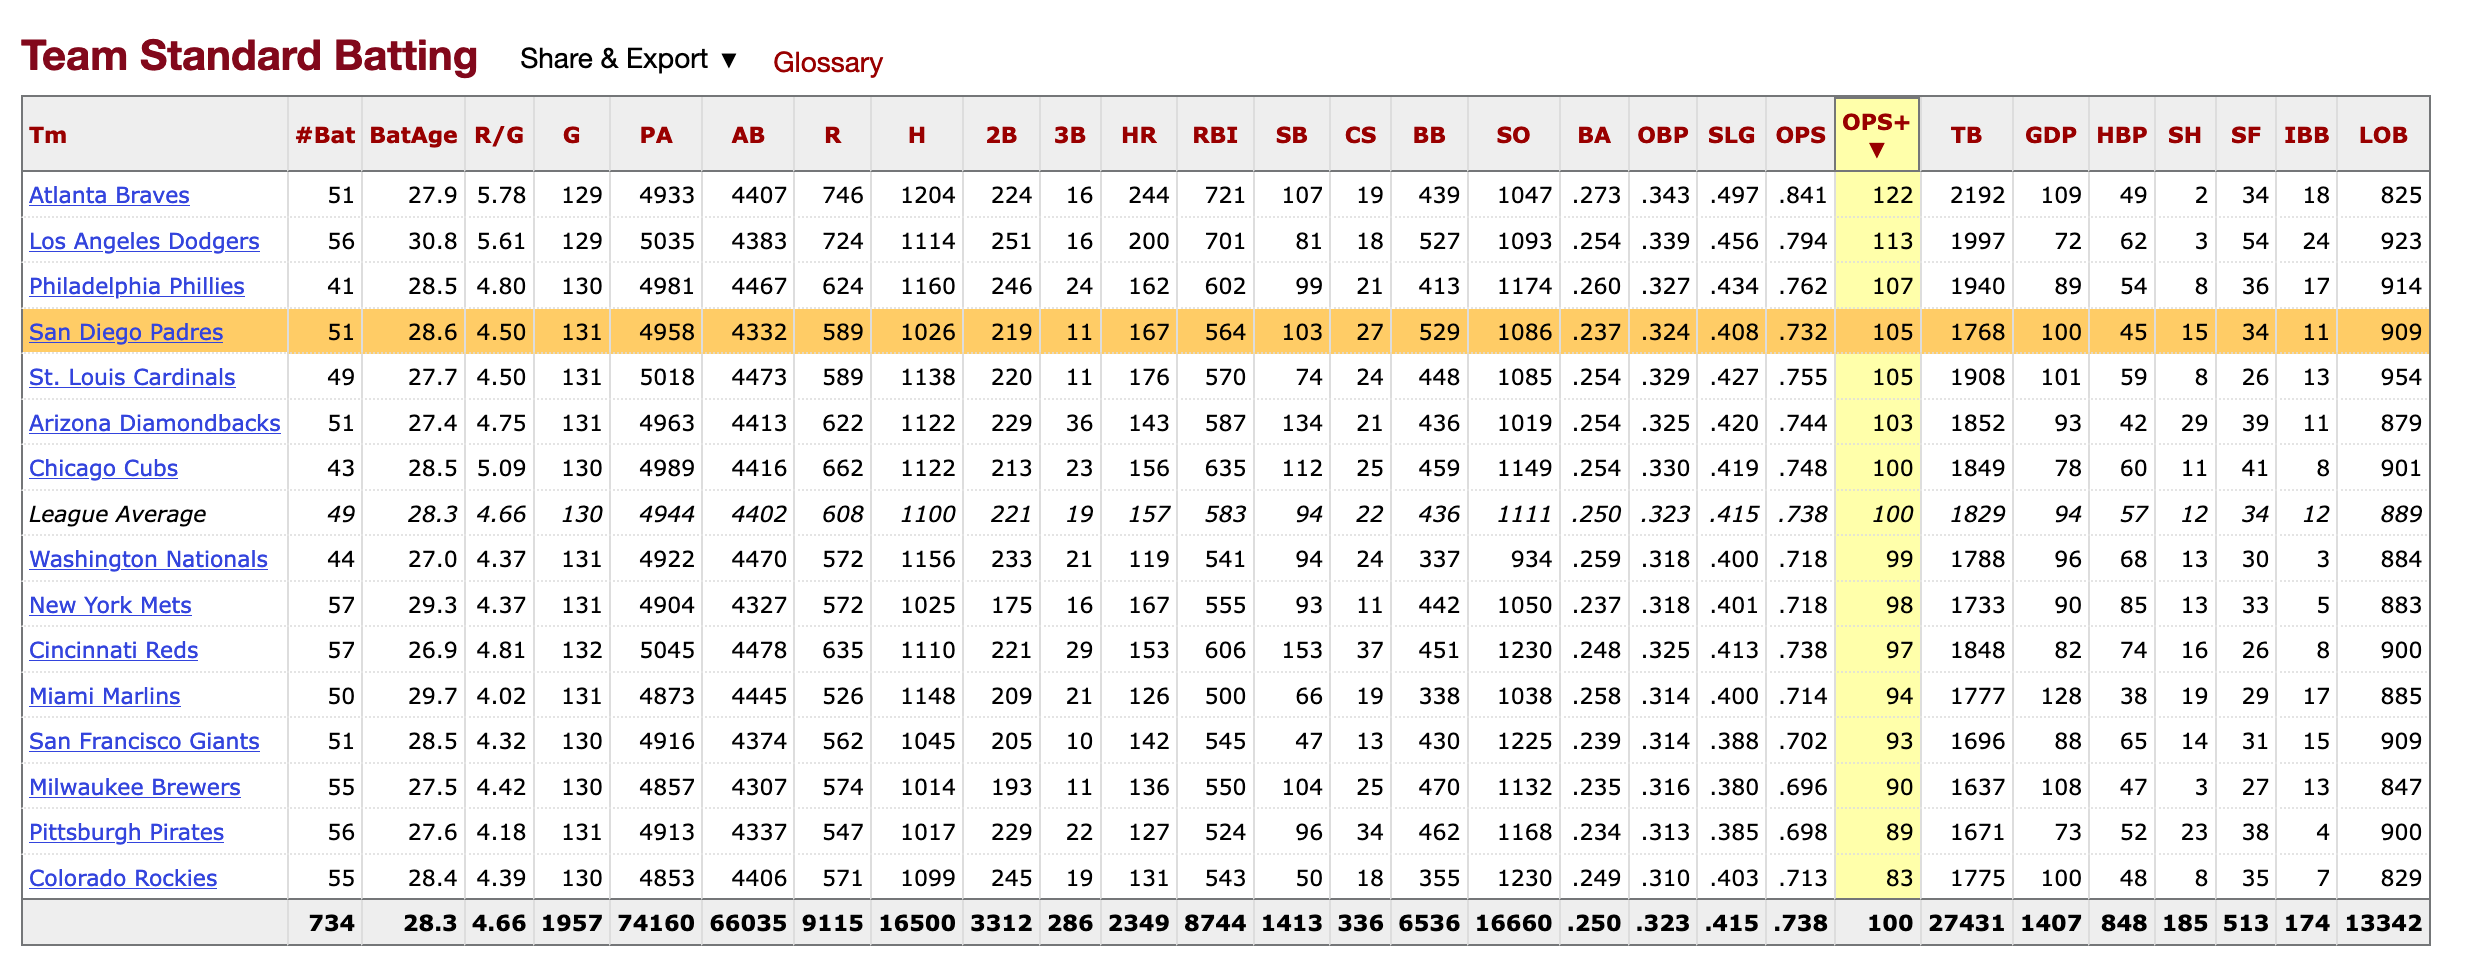
What I found was pretty fascinating - the Padres have talented hitters and pitchers, don’t have crazy differences between actual statistics and ’expected’ statistics, and play great defense.
Standard Team Statistics


Clutch Performance
With the standard indicators “ruled out”, I felt that the the issue must lie with some strange combination of sequencing, park factors, luck, or situational baseball which was coming together to undermine the broadly solid production the Padres were compiling in each facet of the game.
After a long time on BaseballReference.com, I found some data that helped me crack the case… the Padres have performed extremely poorly in clutch situations this year!


One-Run Games
With the Padres performing so poorly in the clutch, I figured their one-run game record was liable to be disappointing. After writing a little code to compute it (embedded at the end), I was able to confirm that’s exactly what’s happened!

Blowout Games
Furthermore, while they might lose close games, they’ve avoided losing games in blowout fashion. Only 2 losses all season have come by 8 or more runs, while they’ve accrued 7 wins by the same margin. The avoidance of large negative run differentials has been a boon to their aggregate run differential - meaning it isn’t as “deflated” as the average team, which I believe contributes to their run differential seeming a bit too good to be true in macro.

Putting it all Together

Code Reference
I would be remiss if I didn’t give another tip of the cap to the excellent baseballr package for R!
Acquiring Game-by-Game Data
library(baseballr)
library(tidyverse)

nl_standings <-  bref_standings_on_date("2023-08-28", "NL Overall", from = FALSE)

# fetch all games played by NL teams in the 2023 season
games <- lapply(nl_standings$Tm, function(x) bref_team_results(x, year = 2023))

# unroll the list into a single dataframe
df <- bind_rows(games)
Computing One Run Game and Blowout Game Measures
# build one run game and blowout game measures
summary <- df %>%
  mutate(win = ifelse(R > RA, 1, 0)) %>%
  group_by(Tm) %>%
  summarize(
    games = n(),
    one_run_games = sum(ifelse(abs(R - RA) == 1, 1, 0)),
    one_run_games_won = sum(ifelse(abs(R - RA) == 1 & win == 1, 1, 0)),
    blowout_games = sum(ifelse(abs(R - RA) > 7, 1, 0)),
    blowout_games_won = sum(ifelse(abs(R - RA) > 7 & win == 1, 1, 0)),
    blowout_games_won_run_differential = sum(ifelse(abs(R - RA) > 7 & win == 1, R - RA, 0)),
    blowout_games_lost = sum(ifelse(abs(R - RA) > 7 & win == 0, 1, 0)),
    blowout_games_lost_run_differential = sum(ifelse(abs(R - RA) > 7 & win == 0, R - RA, 0))
  ) %>%
  mutate(
    pct_games_one_run_games = one_run_games / games,
    one_run_game_winning_pct = one_run_games_won / one_run_games,
    pct_games_blowout_games = blowout_games / games,
    pct_games_blowout_games_won = blowout_games_won / games,
    pct_games_blowout_games_lost = blowout_games_lost / games,
    blowout_games_differential = blowout_games_won_run_differential + blowout_games_lost_run_differential
  )
One Run Games Bar Plot
ggplot(summary, aes(x = reorder(Tm, -one_run_game_winning_pct), y = one_run_game_winning_pct, label = paste0(round(one_run_game_winning_pct * 100, 0), "%"))) +
  geom_col(
    color = "black",
    fill = "#58508d",
    alpha = 0.9
  ) +
  geom_text(vjust = -0.5) +
  scale_y_continuous(labels = percent_format(), breaks = pretty_breaks(6)) +
  expand_limits(y = c(0, 1)) +
  theme_minimal() +
  theme(
    strip.background = element_rect(fill = "grey30"),
    strip.text = element_text(color = "grey97", face = "bold"),
    plot.title = element_text(size = 20, face = "bold"),
    plot.subtitle = element_text(size = 12),
    plot.caption = element_text(colour = "grey60"),
    legend.position = "none",
    plot.title.position = "plot"
  ) +
  labs(
    x = "",
    y = "One Run Game Winning Percentage (%)\n",
    title = "Record in One Run Games (NL Teams)",
    subtitle = "The Padres have only won 23% of their one-run games this season.",
    caption = "conormclaughlin.net"
  )
Blowout Games Scatterplot
library(ggrepel)

ggplot(summary, aes(x = blowout_games_won, y = blowout_games_lost, label = Tm,)) +
  geom_point(
    color = "black",
    fill = "#58508d",
    size = 4,
    alpha = 0.8,
    stroke = 1,
    shape = 21
  ) +
  geom_abline(intercept = 0, slope = 1, linetype = "dashed") +
  coord_fixed(0.8) +
  geom_text_repel(size = 4, fontface = "bold") +
  scale_y_continuous(breaks = pretty_breaks(6)) +
  scale_x_continuous(breaks = pretty_breaks(5)) +
  theme_minimal() +
  theme(
    strip.background = element_rect(fill = "grey30"),
    strip.text = element_text(color = "grey97", face = "bold"),
    plot.title = element_text(size = 20, face = "bold"),
    plot.subtitle = element_text(size = 12),
    plot.caption = element_text(colour = "grey60"),
    legend.position = "none",
    plot.title.position = "plot"
  ) +
  labs(
    x = "\nBlowout Losses (8+ Runs)",
    y = "Blowout Losses (8+ Runs)\n",
    title = "NL Teams: Blowout Games",
    subtitle = "The Padres have avoided blowout losses all year while\nracking up several blowout wins, padding their\naggregate run differential.",
    caption = "conormclaughlin.net"
  )
Building the Combined Scatterplot
library(ggrepel)
library(scales)

ggplot(summary, aes(x = blowout_games_differential, y = one_run_game_winning_pct, label = Tm)) +
  geom_point(
    color = "black",
    fill = "#58508d",
    size = 4,
    alpha = 0.8,
    stroke = 1,
    shape = 21
  ) +
  xlim(-120, 120) +
  expand_limits(y = c(0.15, 0.85)) +
  geom_vline(xintercept = 0, linetype = "dashed") +
  geom_hline(yintercept = 0.5, linetype = "dashed") +
  geom_text_repel(fontface = "bold") +
  scale_y_continuous(labels = percent_format(), breaks = pretty_breaks()) +
  theme_minimal() +
  theme(
    strip.background = element_rect(fill = "grey30"),
    strip.text = element_text(color = "grey97", face = "bold"),
    plot.title = element_text(size = 20, face = "bold"),
    plot.subtitle = element_text(size = 12),
    plot.caption = element_text(colour = "grey60"),
    legend.position = "none",
    plot.title.position = "plot"
  ) +
  labs(
    x = "\nRun Differential in Blowout Games (W or L by 8+ Run Margin)",
    y = "One Run Game Winning Percentage (%)\n",
    title = "One Chart to Explain the Padres' Strange Season",
    subtitle = "Despite a +56 run differential, the Padres are only 62-70 this season. Two factors seem to explain this:\n\n1) The Padres have been terrible in the clutch this season (both hitters and pitchers), leading to an\nNL-worst winning percentage of only 23% in one-run games.\n2) The Padres have been on the 'right side' of blowout games all season, with very few losses and a lot\nof wins. The wins have resulted in quite a bit of stat-padding (kind of like 'garbage yardage' in fantasy\nfootball), which has boosted the Padres' run differential without contributing to incremental wins.",
    caption = "conormclaughlin.net"
  )