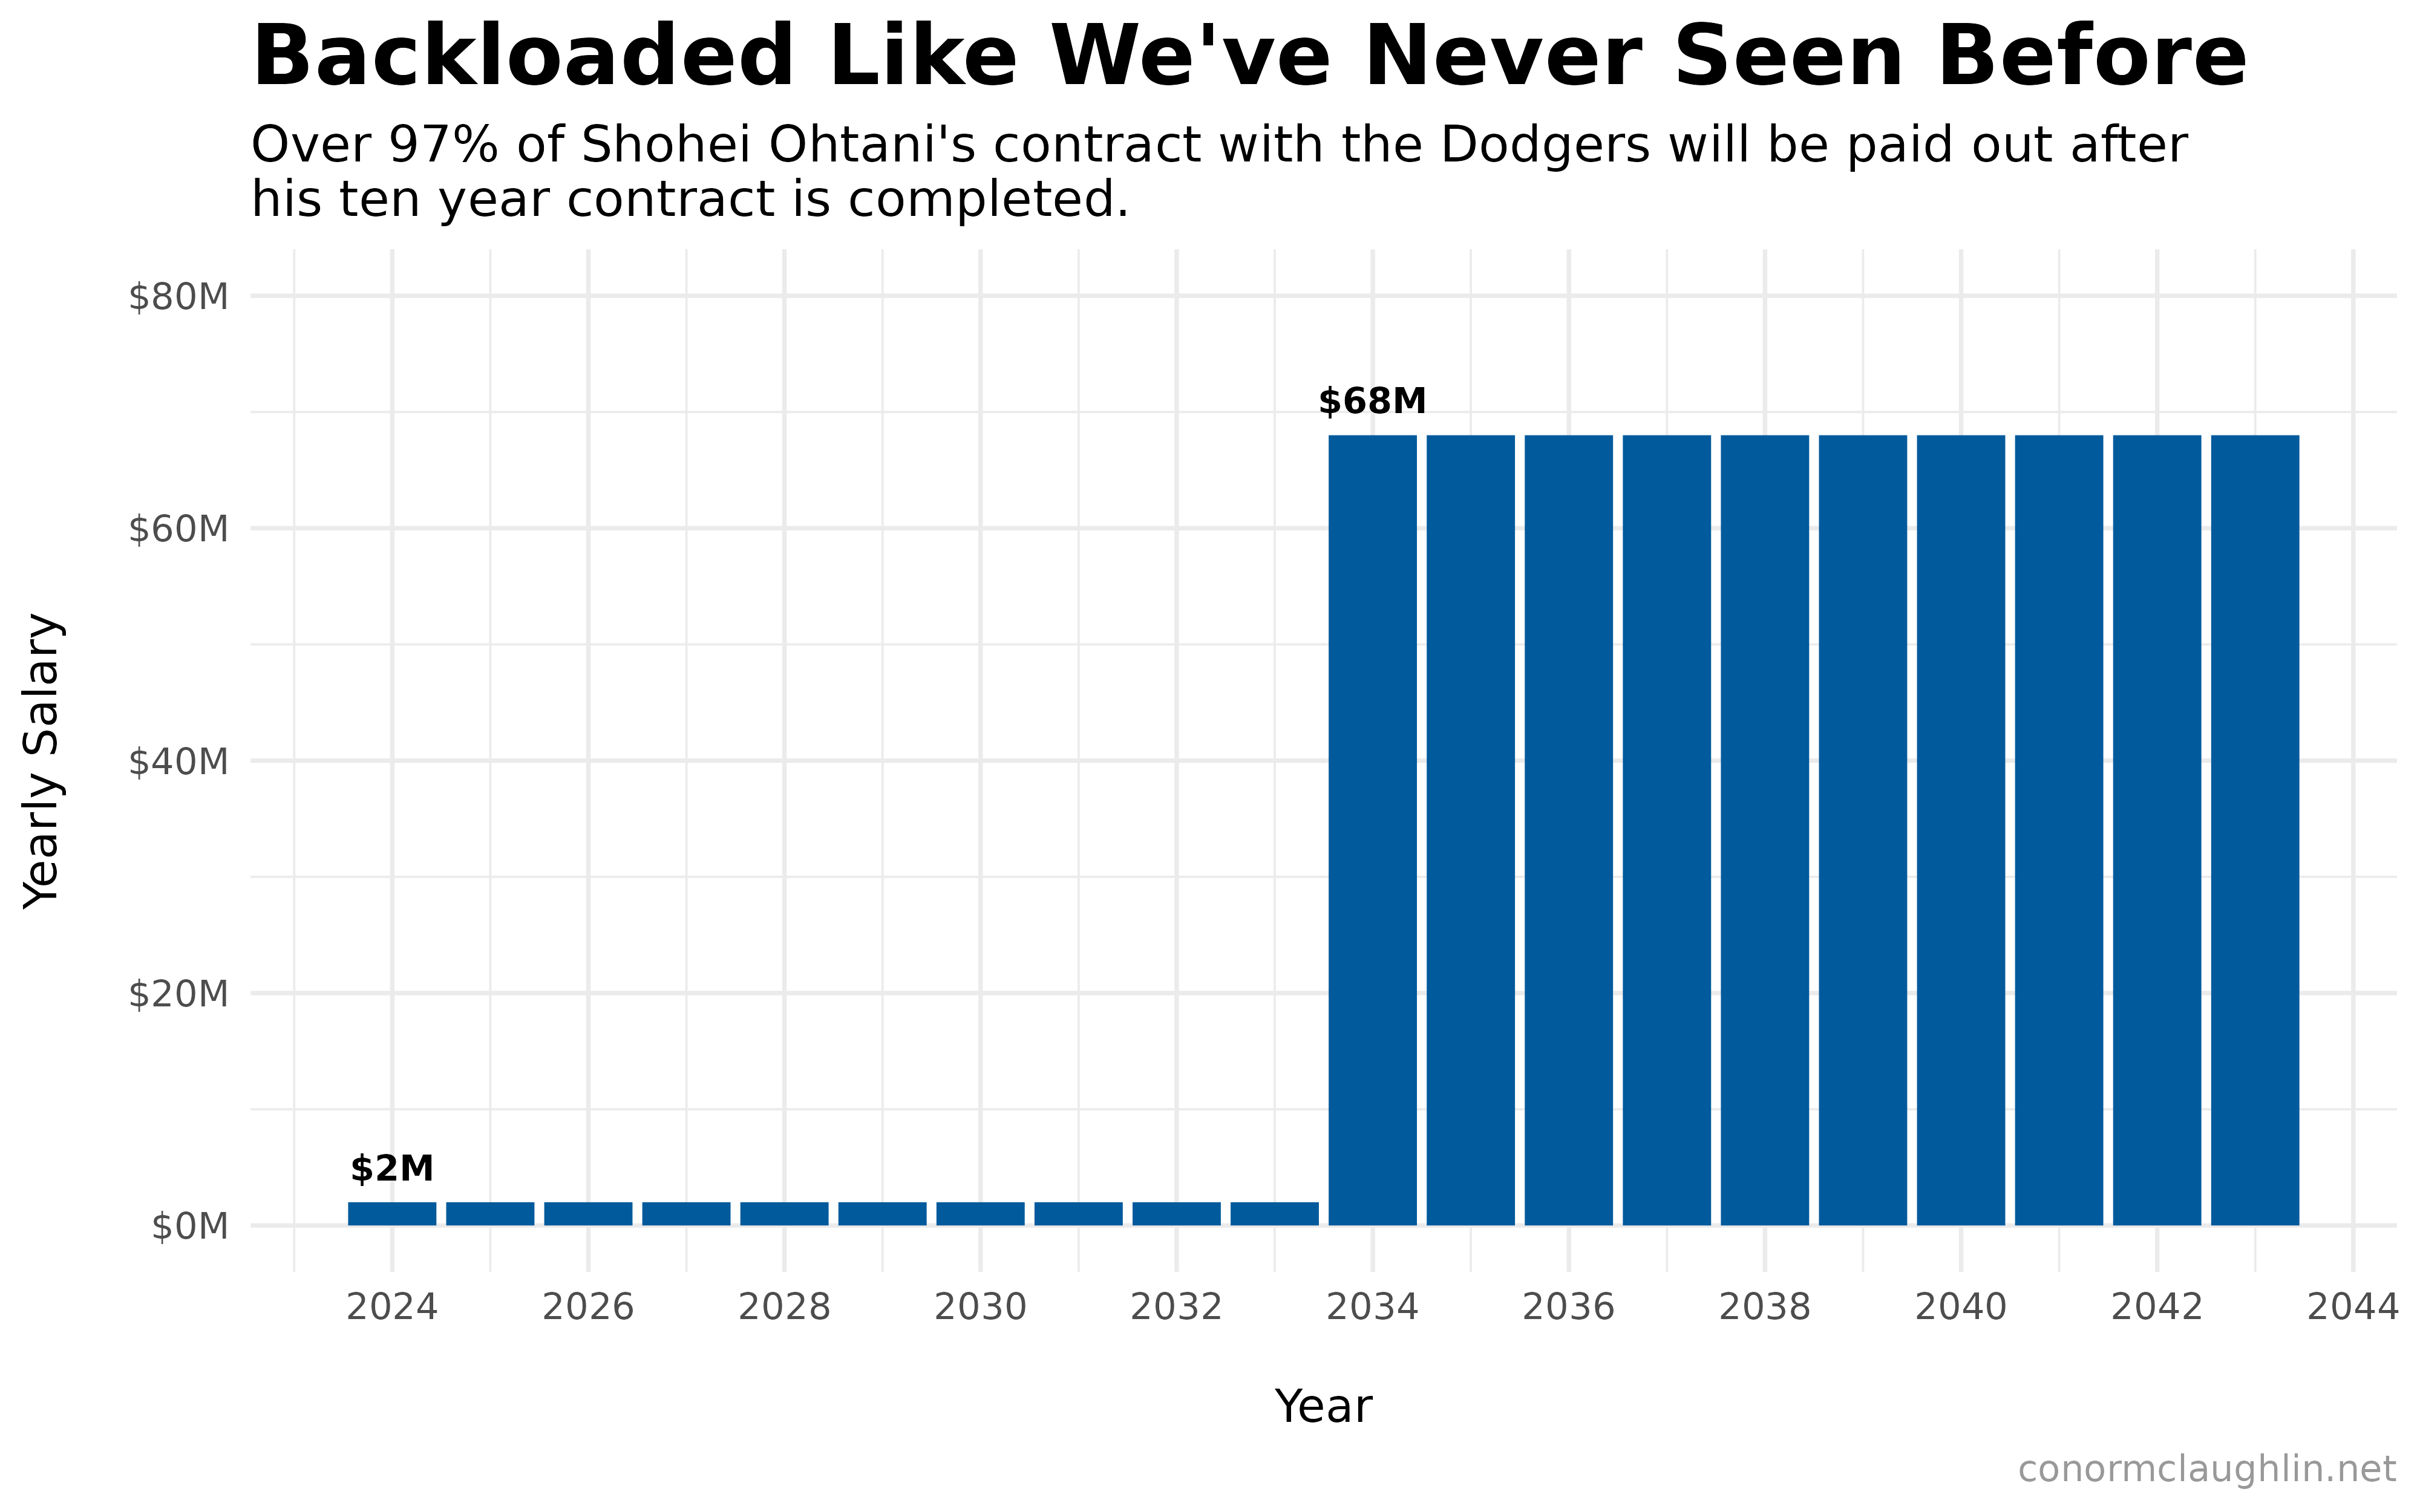
Earlier today, ESPN reported some bombshell news about Shohei Ohtani’s new contract: it’s heavily backloaded.
So heavily so that Ohtani will only take $2M of salary each of the next ten years, with the remaining $680M (over 97% of the value) paid out between 2034 and 2043.
Time Value of Money and Net Present Value (NPV)
The heavily deferred nature of contract piqued my curiosity for what the deal should realistically be valued at today. We all know that a bird in hand can be worth two in the bush - the longer the time horizon for a nominal sum to be paid back, the less valuable it is to hold that sum today.
To get a concrete answer, we can compute the Net Present Value of Ohtani’s salary, which discounts the cash flows in future periods and then aggregates them into a single figure of what they are worth “today”. We can ignore the Initial investment part of this, since Ohtani is not outlaying any capital.

The key assumption we’ll make in this exercise, since we now know the length of Ohtani’s deferrals and the yearly payments, will be to set the Discount Rate.
We’ll assume the Dodgers are like any other large business and will start investing money today (either in their business or in the markets) so that they will have sufficient future capital to meet their obligations to Ohtani. As such, we will arbitrarily set the Discount Rate to 7%, as that is generally what the stock market will return to investors in the long run.
Ohtani’s Contract by Year
With the background laid out, we can get straight into the math - here is a table of Ohtani’s yearly salary, today’s Net Present Value of each year’s salary, and the cumulative Net Present Value of all the years of payments.
You can see that the $68.0M owed to Ohtani in 2043, the last year of his contract, corresponds to a NPV of $17.6M. This is because it only takes $17.6M of current capital, plus twenty years of compounding at 7%, to be able to afford to make that $68M payment in the future.
| Year | Salary | NPV of Salary | Cumulative NPV |
|---|---|---|---|
| 2024 | $2.0 M | $1.87 M | $1.87 M |
| 2025 | $2.0 M | $1.75 M | $3.62 M |
| 2026 | $2.0 M | $1.63 M | $5.25 M |
| 2027 | $2.0 M | $1.53 M | $6.77 M |
| 2028 | $2.0 M | $1.43 M | $8.20 M |
| 2029 | $2.0 M | $1.33 M | $9.53 M |
| 2030 | $2.0 M | $1.25 M | $10.78 M |
| 2031 | $2.0 M | $1.16 M | $11.94 M |
| 2032 | $2.0 M | $1.09 M | $13.03 M |
| 2033 | $2.0 M | $1.02 M | $14.05 M |
| 2034 | $68.0 M | $32.31 M | $46.35 M |
| 2035 | $68.0 M | $30.19 M | $76.55 M |
| 2036 | $68.0 M | $28.22 M | $104.76 M |
| 2037 | $68.0 M | $26.37 M | $131.14 M |
| 2038 | $68.0 M | $24.65 M | $155.78 M |
| 2039 | $68.0 M | $23.03 M | $178.82 M |
| 2040 | $68.0 M | $21.53 M | $200.34 M |
| 2041 | $68.0 M | $20.12 M | $220.46 M |
| 2042 | $68.0 M | $18.80 M | $239.26 M |
| 2043 | $68.0 M | $17.57 M | $256.84 M |
Comparison to Mike Trout
Four seasons ago, Mike Trout signed what was baseball’s largest contract - a 12 year megadeal worth $426.5M in total. While the nominal value of Ohtani’s contract is much, much larger than Trout’s - it might not be more valuable!
I say that in the sense of “more valuable this moment due to the time value of money” - most economists would rather have a slightly fewer nominal dollars, much more quickly, as Trout’s contract gives him, versus Ohtani’s contract, which awards many more nominal dollars, but most of which are delivered far into the future.
However, I don’t want to insinuate that Ohtani has been played for a sucker by the Dodgers or his agent - by all accounts, Ohtani wants to build a competitive roster around him, and deferring his salary allows 1) his agent to still claim a huge nominal contract figure of $700m, while 2) allowing the Dodgers some financial wiggle room, where they can afford better complementary players over the next decade.
Comparing NPV of Both Contracts
Take a peek at the interesting comparison of the two contracts below - Ohtani’s deal never quite turns the corner on Trout’s in terms of current NPV.

Trout’s Contract by Year
| Year | Salary | NPV of Salary | Cumulative NPV |
|---|---|---|---|
| 2019 | $17.67 M | $16.51 M | $16.51 M |
| 2020 | $37.77 M | $32.99 M | $49.50 M |
| 2021 | $37.17 M | $30.34 M | $79.84 M |
| 2022 | $37.22 M | $28.39 M | $108.23 M |
| 2023 | $37.12 M | $26.46 M | $134.69 M |
| 2024 | $37.12 M | $24.73 M | $159.43 M |
| 2025 | $37.12 M | $23.11 M | $182.54 M |
| 2026 | $37.12 M | $21.60 M | $204.14 M |
| 2027 | $37.12 M | $20.19 M | $224.33 M |
| 2028 | $37.12 M | $18.87 M | $243.20 M |
| 2029 | $37.12 M | $17.63 M | $260.83 M |
| 2030 | $37.12 M | $16.48 M | $277.31 M |