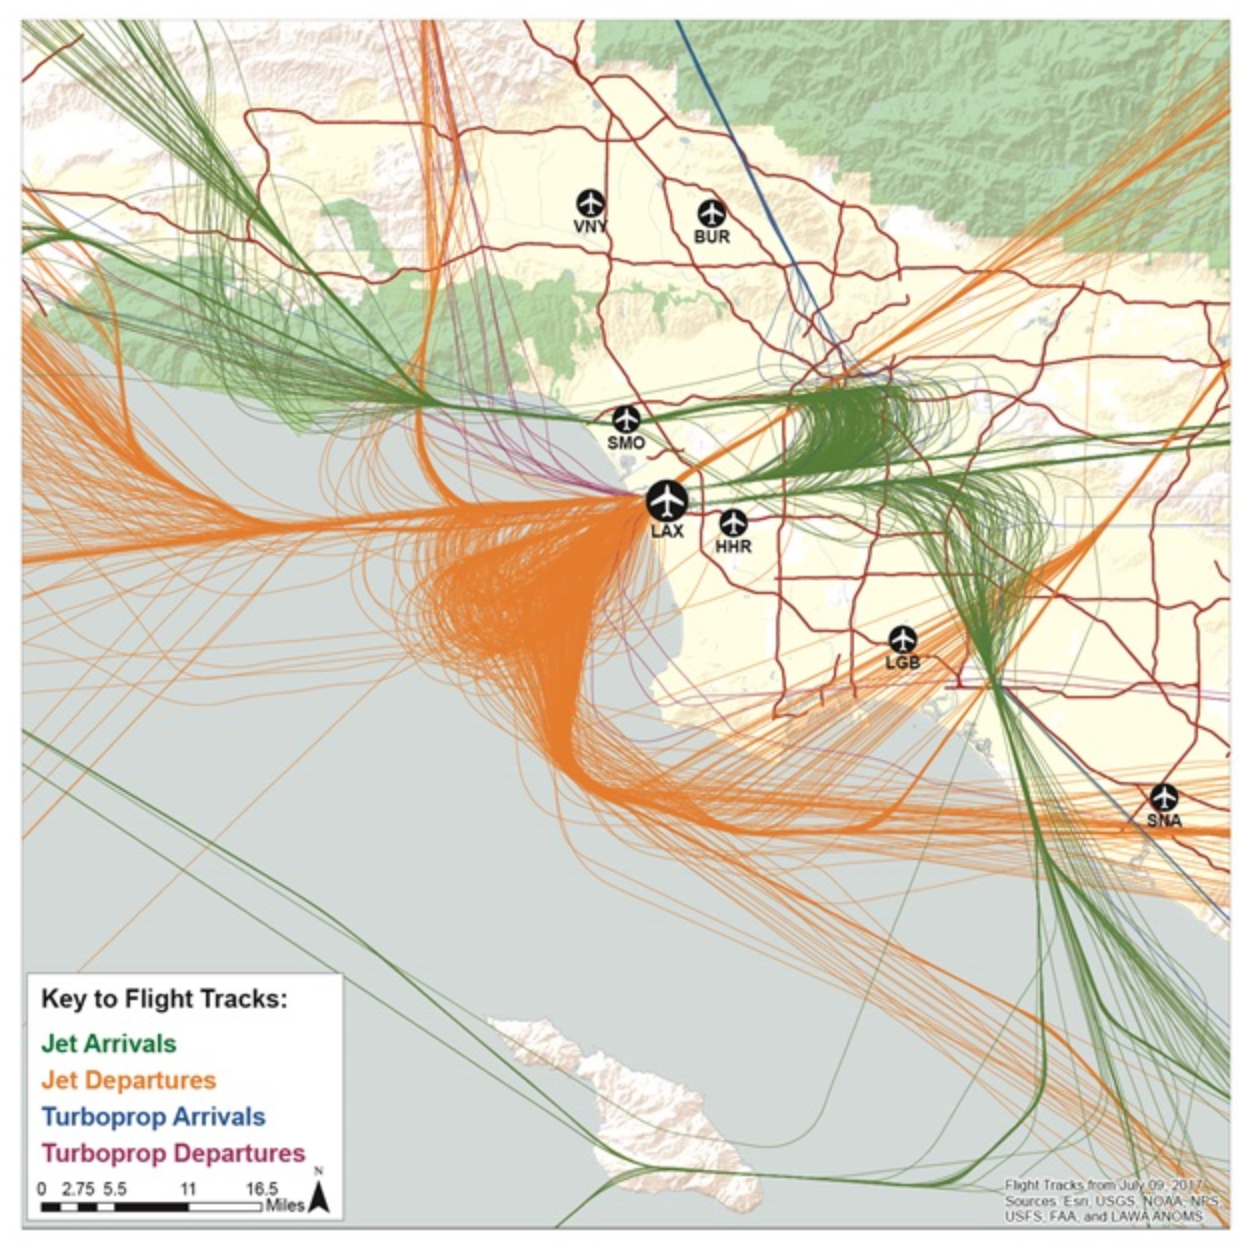
One of the many things I enjoy about living in Santa Monica is that it sits directly underneath the Western/Northern approach to LAX. Every 4 minutes, or so, a plane will fly directly overhead, having come across from Malibu, before continuing inland towards Downtown Los Angeles. There, it will execute a big sweeping turn that aligns it with the incoming traffic from the east, which it will zipper into for the final descent westward towards the sea.
With all this activity happening overhead, I will frequently open up the FlightAware app on my phone to check the details of planes overhead - especially when I notice big ones! LAX is lucky to still have scheduled service on the 747 and A380 from a variety of airlines (Emirates, Asiana, Qantas, Korean, Lufthansa, British Airways, off the top of my head), and it’s extremely cool to spot a one of those giants in the air above Santa Monica and see it’s an A380 from Seoul, completing its twelve hour journey across the Pacific Ocean.
I’ve written before about some of the tinkering I did to build a flight arrivals app for my Tidbyt smart display - given the amount of enjoyment I get from checking FlightAware, I thought that this “tell me about the planes overhead” use case could be another compelling ambient information display.
Before turning this into a Tidbyt app, though, I needed to figure out how to source the data about planes overhead in a way that is easy, sustainable, and informative - that topic is what I’ll be blogging about today!
Capturing Planes Overhead
What is OpenSky?
After finding that most commercial flight tracking APIs are prohibitively expensive for what I am looking to do, I found myself reading about OpenSky. OpenSky is a crowd-sourced, non-profit community, which pools data from volunteer-operated ADS-B receivers around the world to monitor global air traffic. Regulators around the world such as the FAA have required planes to have active ADS-B transponders emitting position and heading information, so that air-traffic controllers can better understand the traffic in their airspace. Hence, the OpenSky network has excellent coverage of almost all commercial and private flight activity happening, especially in a place like Los Angeles.
Querying the OpenSky REST API
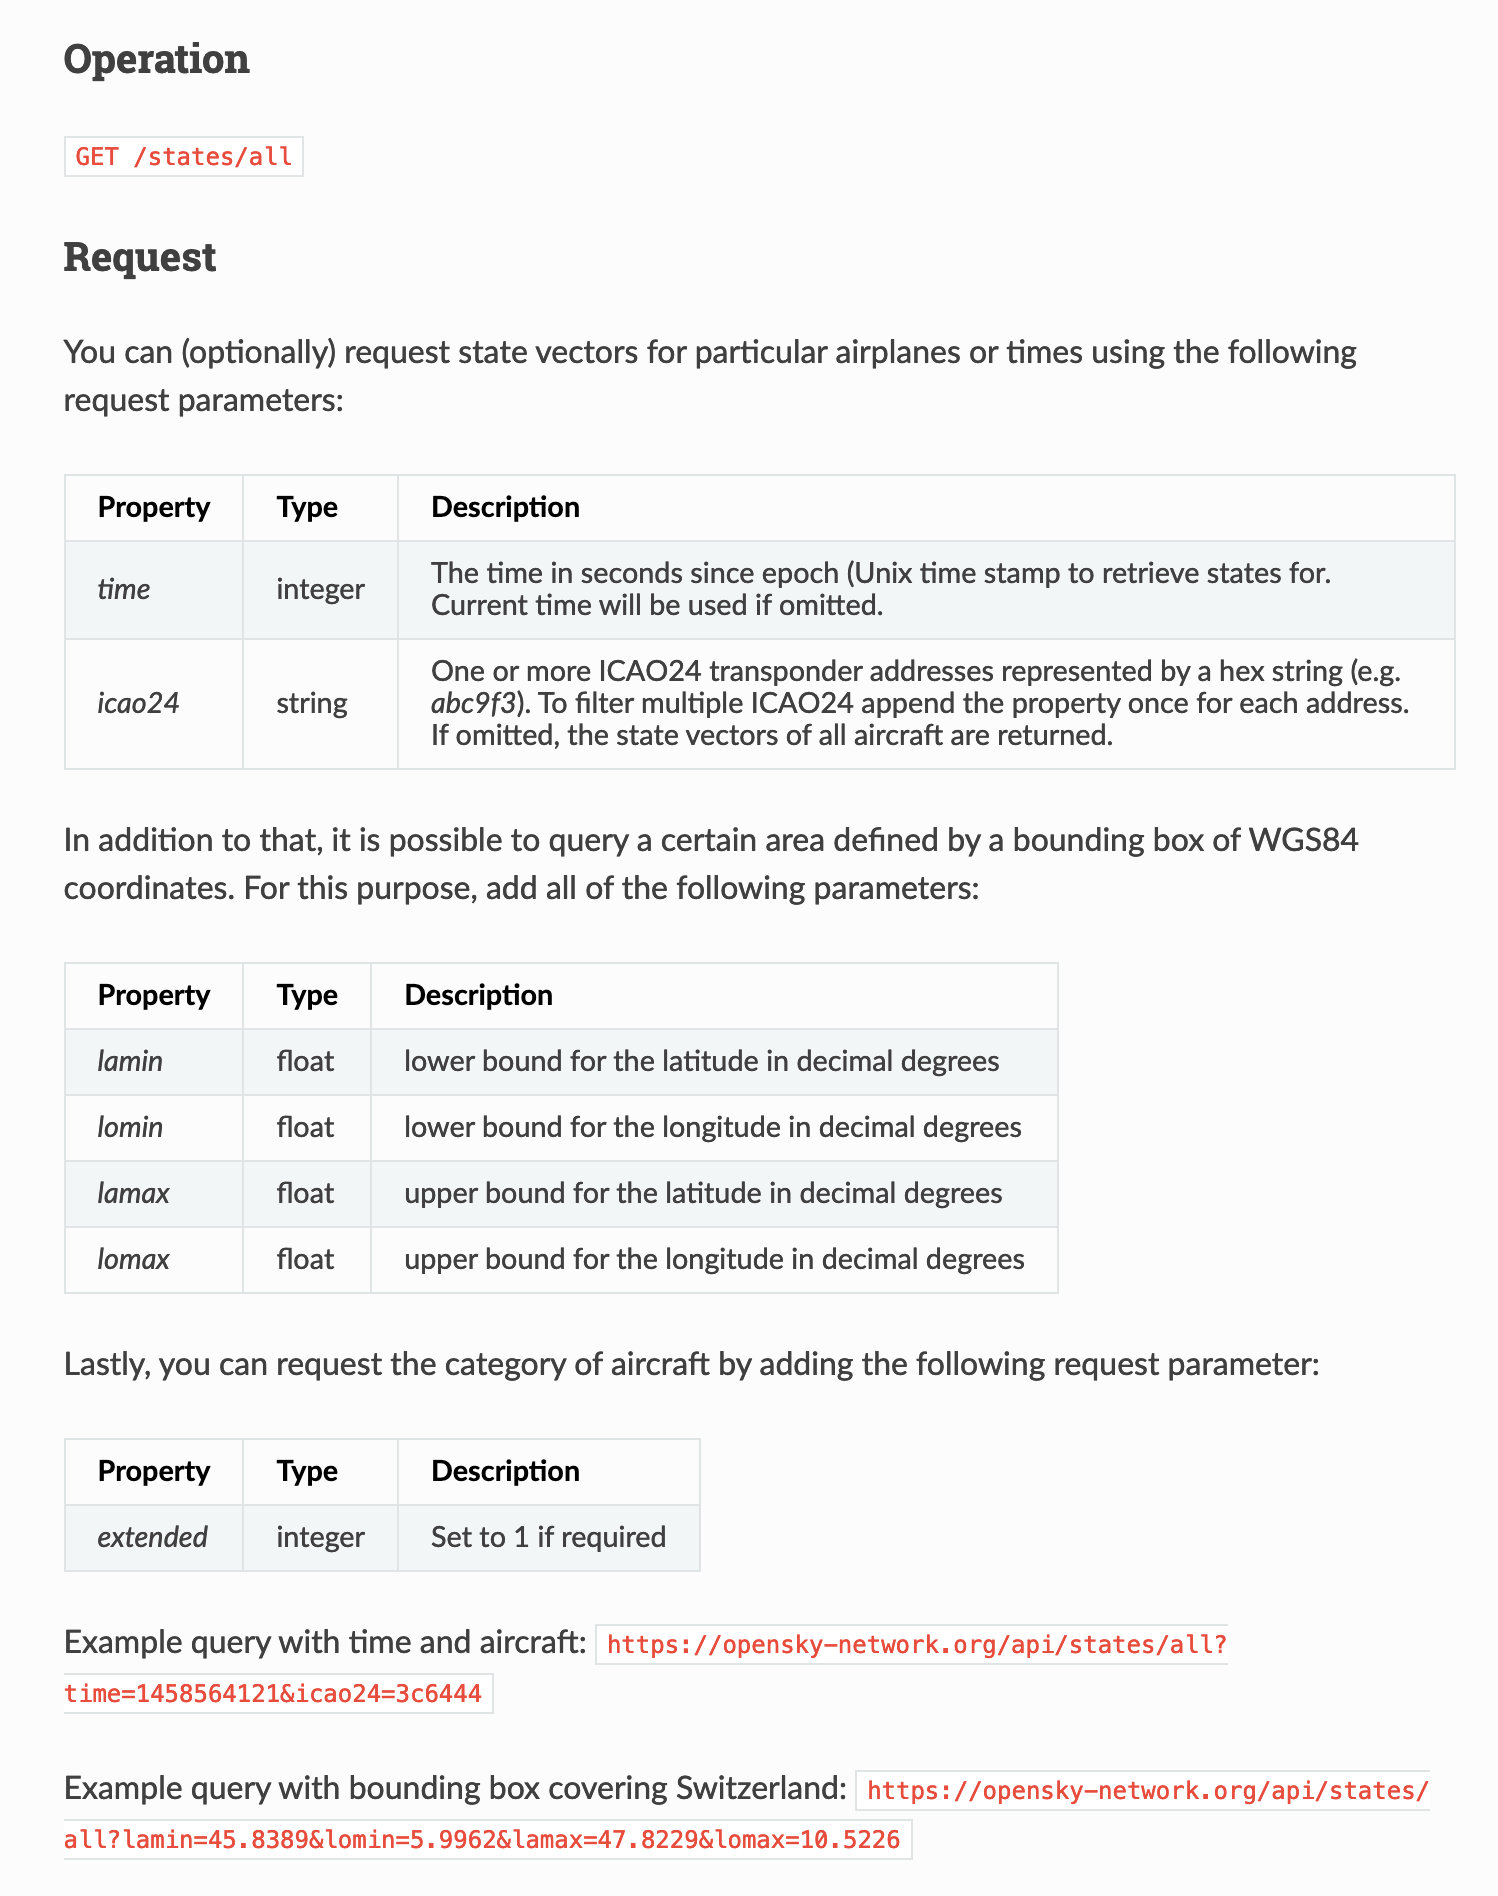
The most basic thing to do with OpenSky is to look at the state vectors of aircraft in a defined area - their API, when prompted with a time and bounding box, will return all set of all the aircraft in that space at that time.
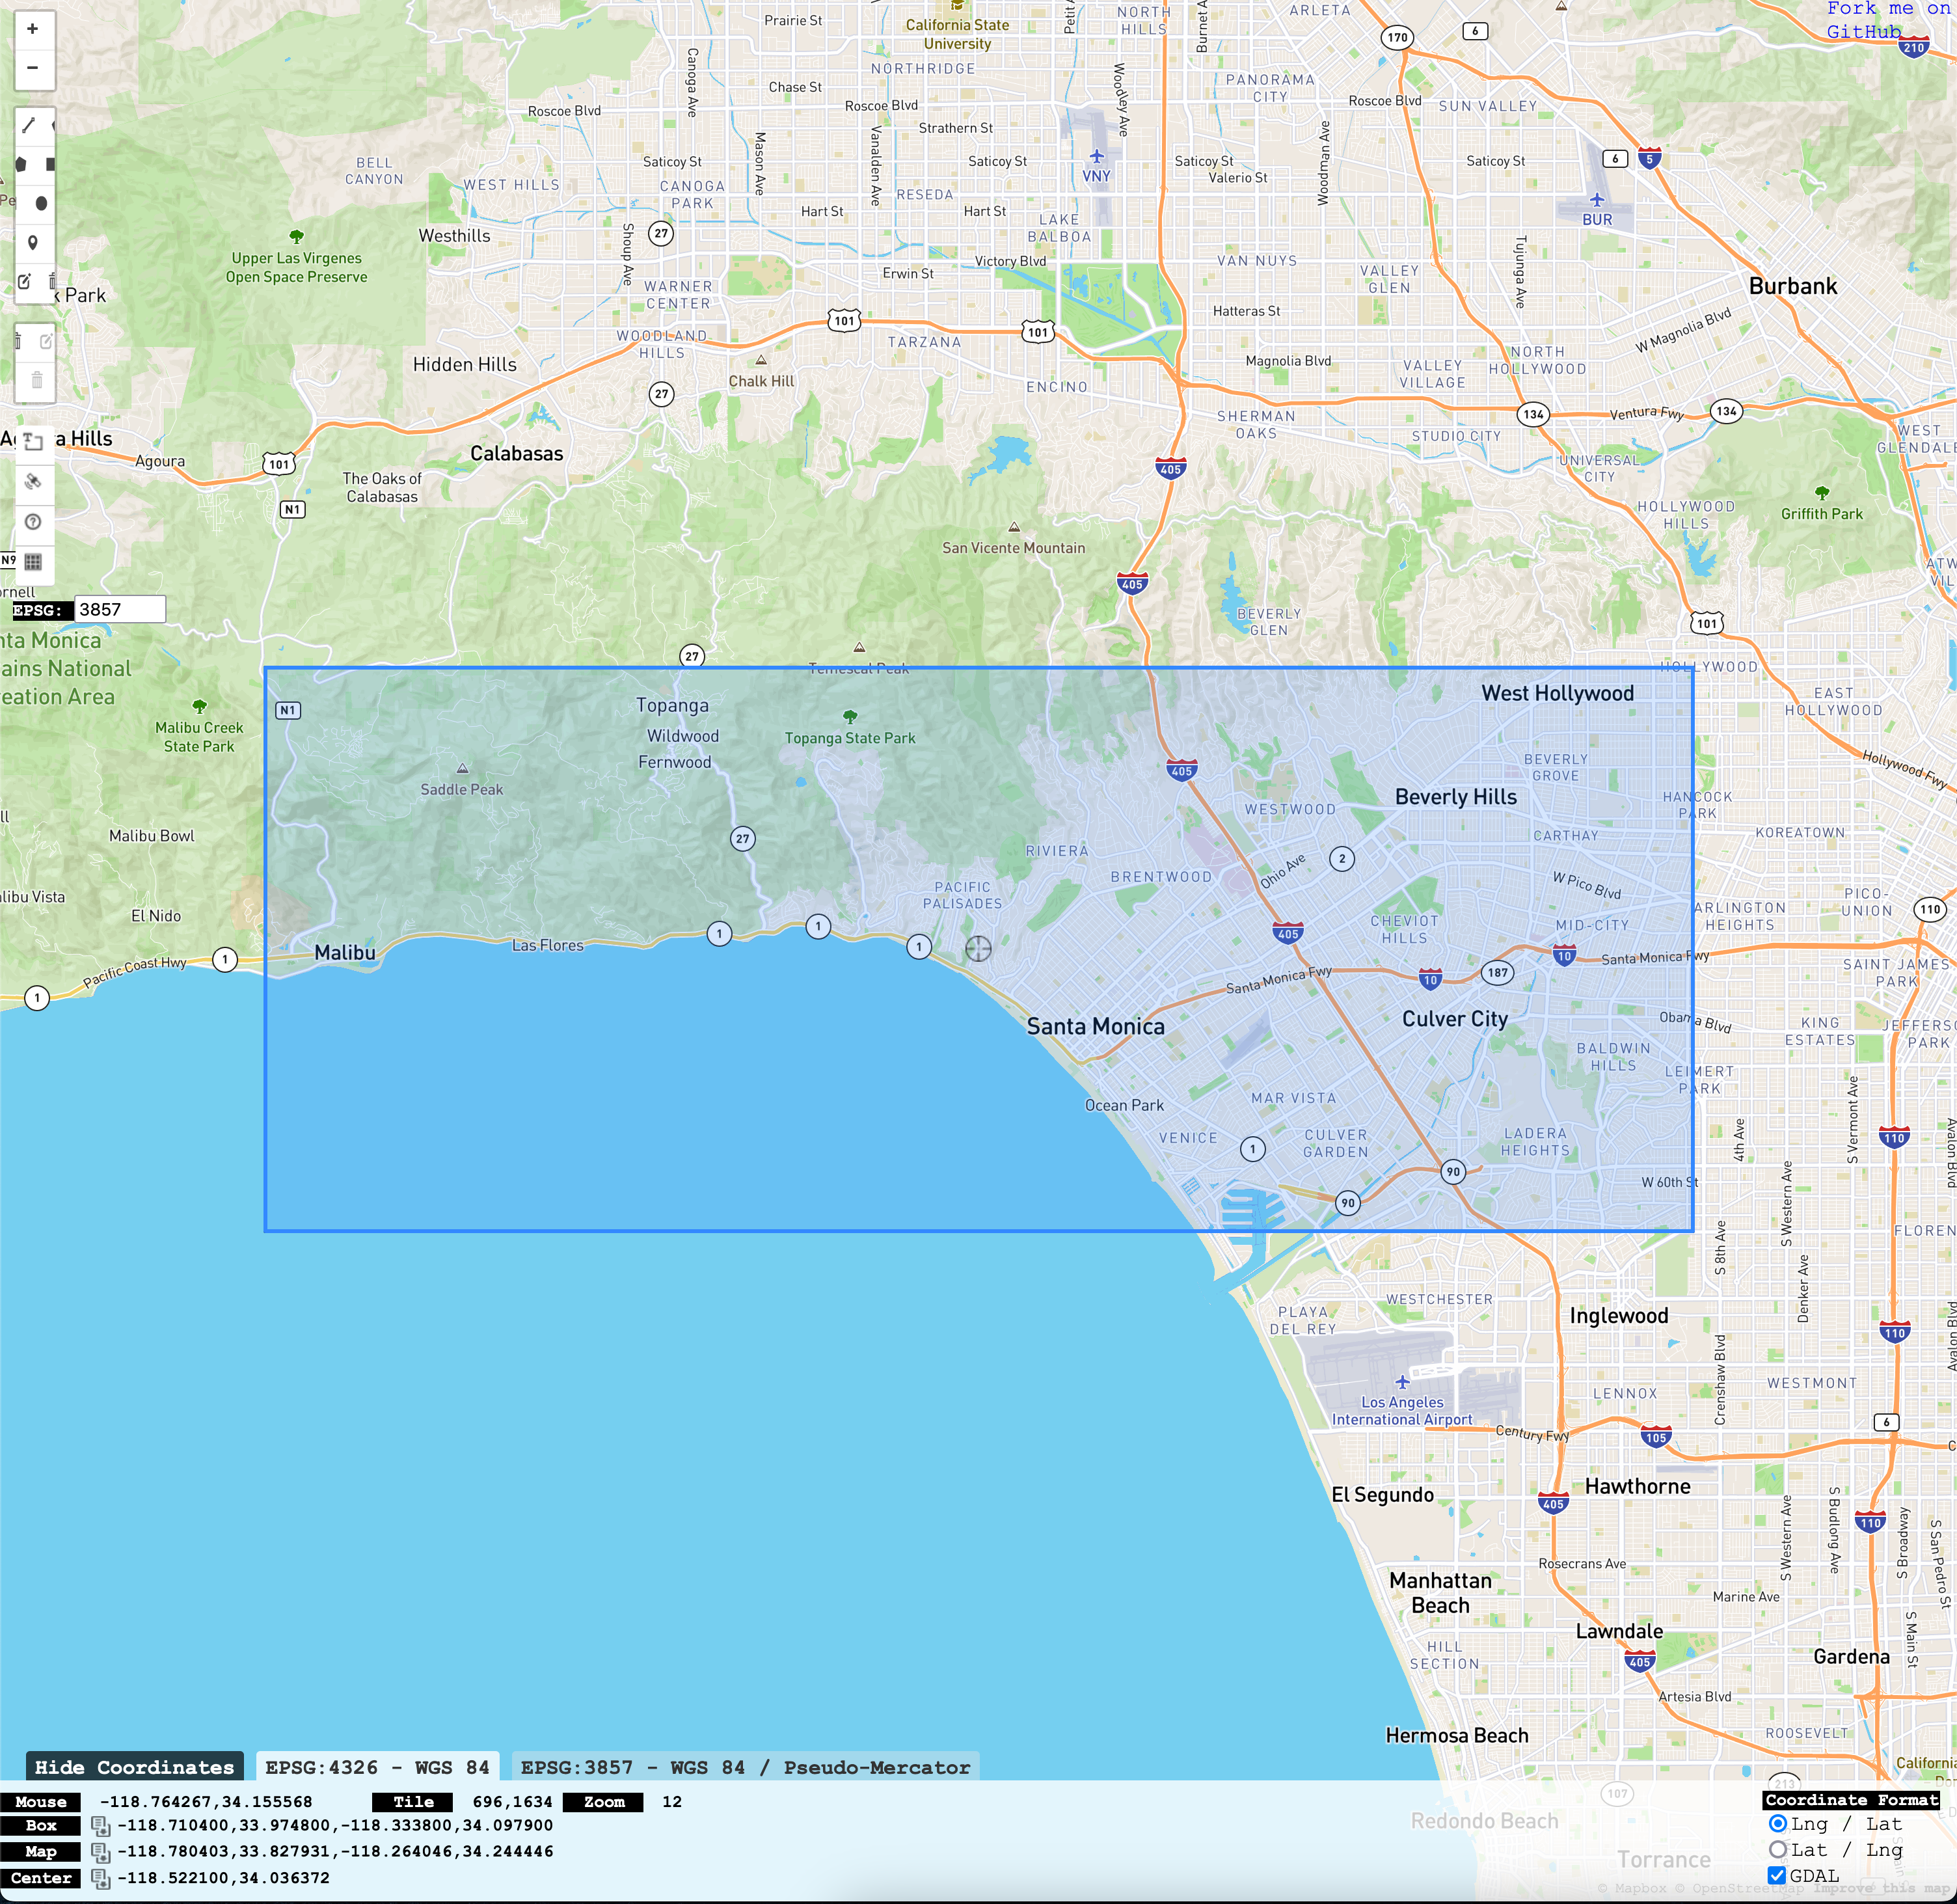
Define Bounding Box
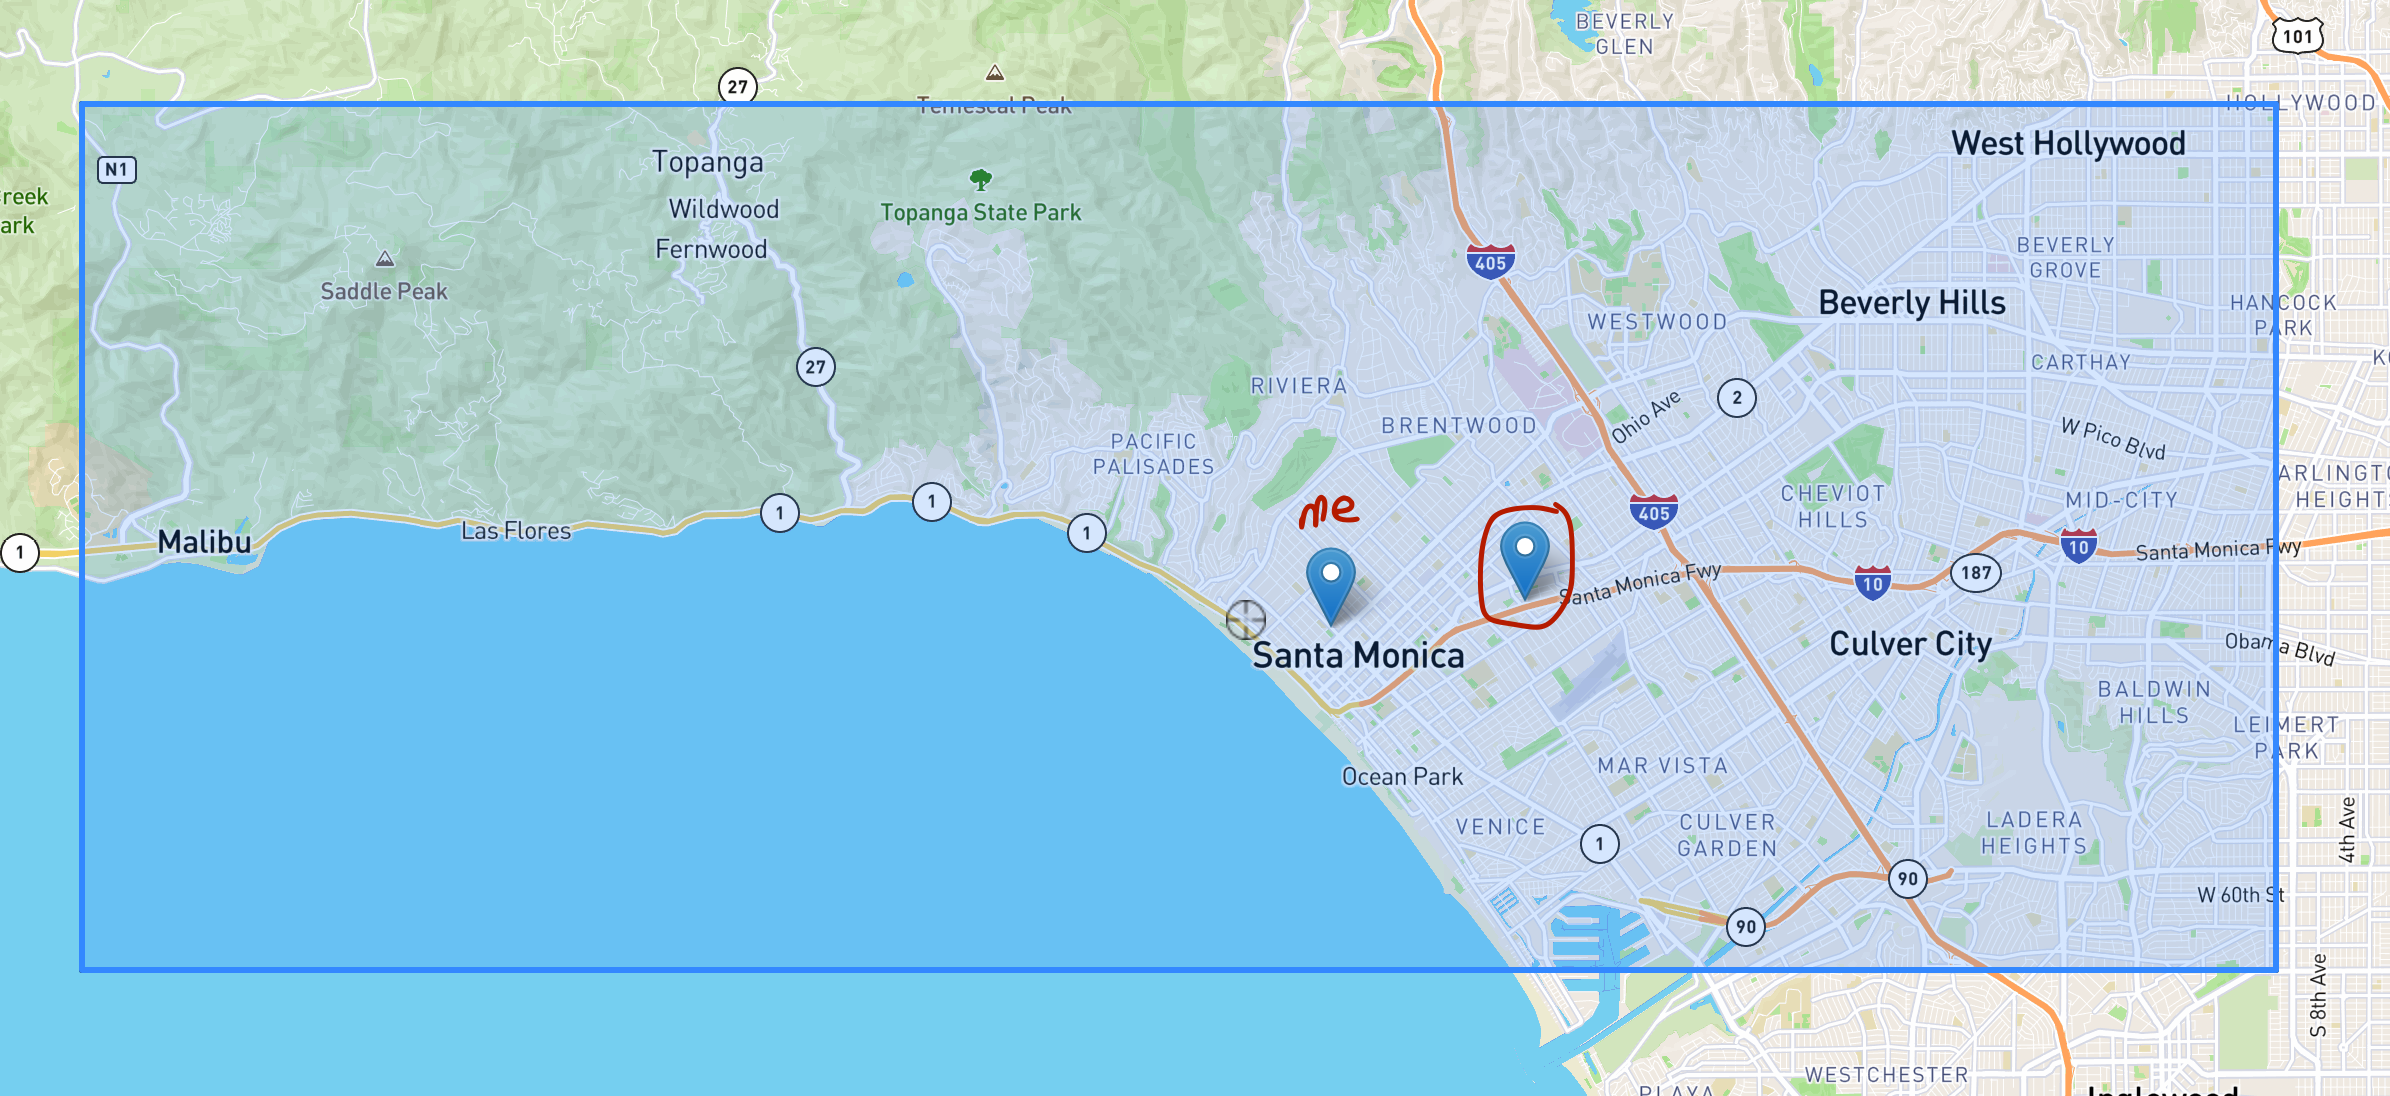
To define my area of interest, I’ve drawn a bounding box centered on Santa Monica, skewed a bit west out to Malibu - as that is a core part of the western approach to LAX. We’ll pass this box into our OpenSky API request to only capture aircraft inside these bounds.
Example Query
After making an OpenSky account (free, ups your daily API calls), it’s easy to call the API, passing the bounding box in the params and OpenSky credentials in the auth tuple.
import requests

params = {
    'lamin': '33.9748',
    'lomin': '-118.7104',
    'lamax': '34.0979',
    'lomax': '-118.3338',
    'extended': 1
}

r = requests.get('https://opensky-network.org/api/states/all', params=params, auth=(USERNAME, PASSWORD))

r.json()
Outputting the retrieved data in JSON format shows us exactly what we were hoping to see! There is currently one plane overhead in our bounding box: SWA3275, better known as Southwest Airlines Flight 3275.
{'time': 1707885494, 'states': [['ac0bfb', 'SWA3275 ', 'United States', 1707885494, 1707885494, -118.4627, 34.0271, 11750.04, False, 214.8, 349.09, 2.93, None, 11772.9, '6713', False, 0, 0]]}
Double-checking with FlightAware’s site, we can validate that this plane flew directly over Santa Monica on its way to Sacramento from San Diego - pretty cool!

Note: API Access Limits
OpenSky’s page on API limits tells us that:
OpenSky users get 4000 API credits per day. For higher request loads please contact OpenSky.
With 1440 minutes in the course of a day, we clearly have plenty of headroom to acquire fresh data every minute. One request every 30 seconds would also stay well under the usage cap. As such, you will only need to worry about API usage if you plan to query this endpoint with <30 second latency.
Enriching the Data
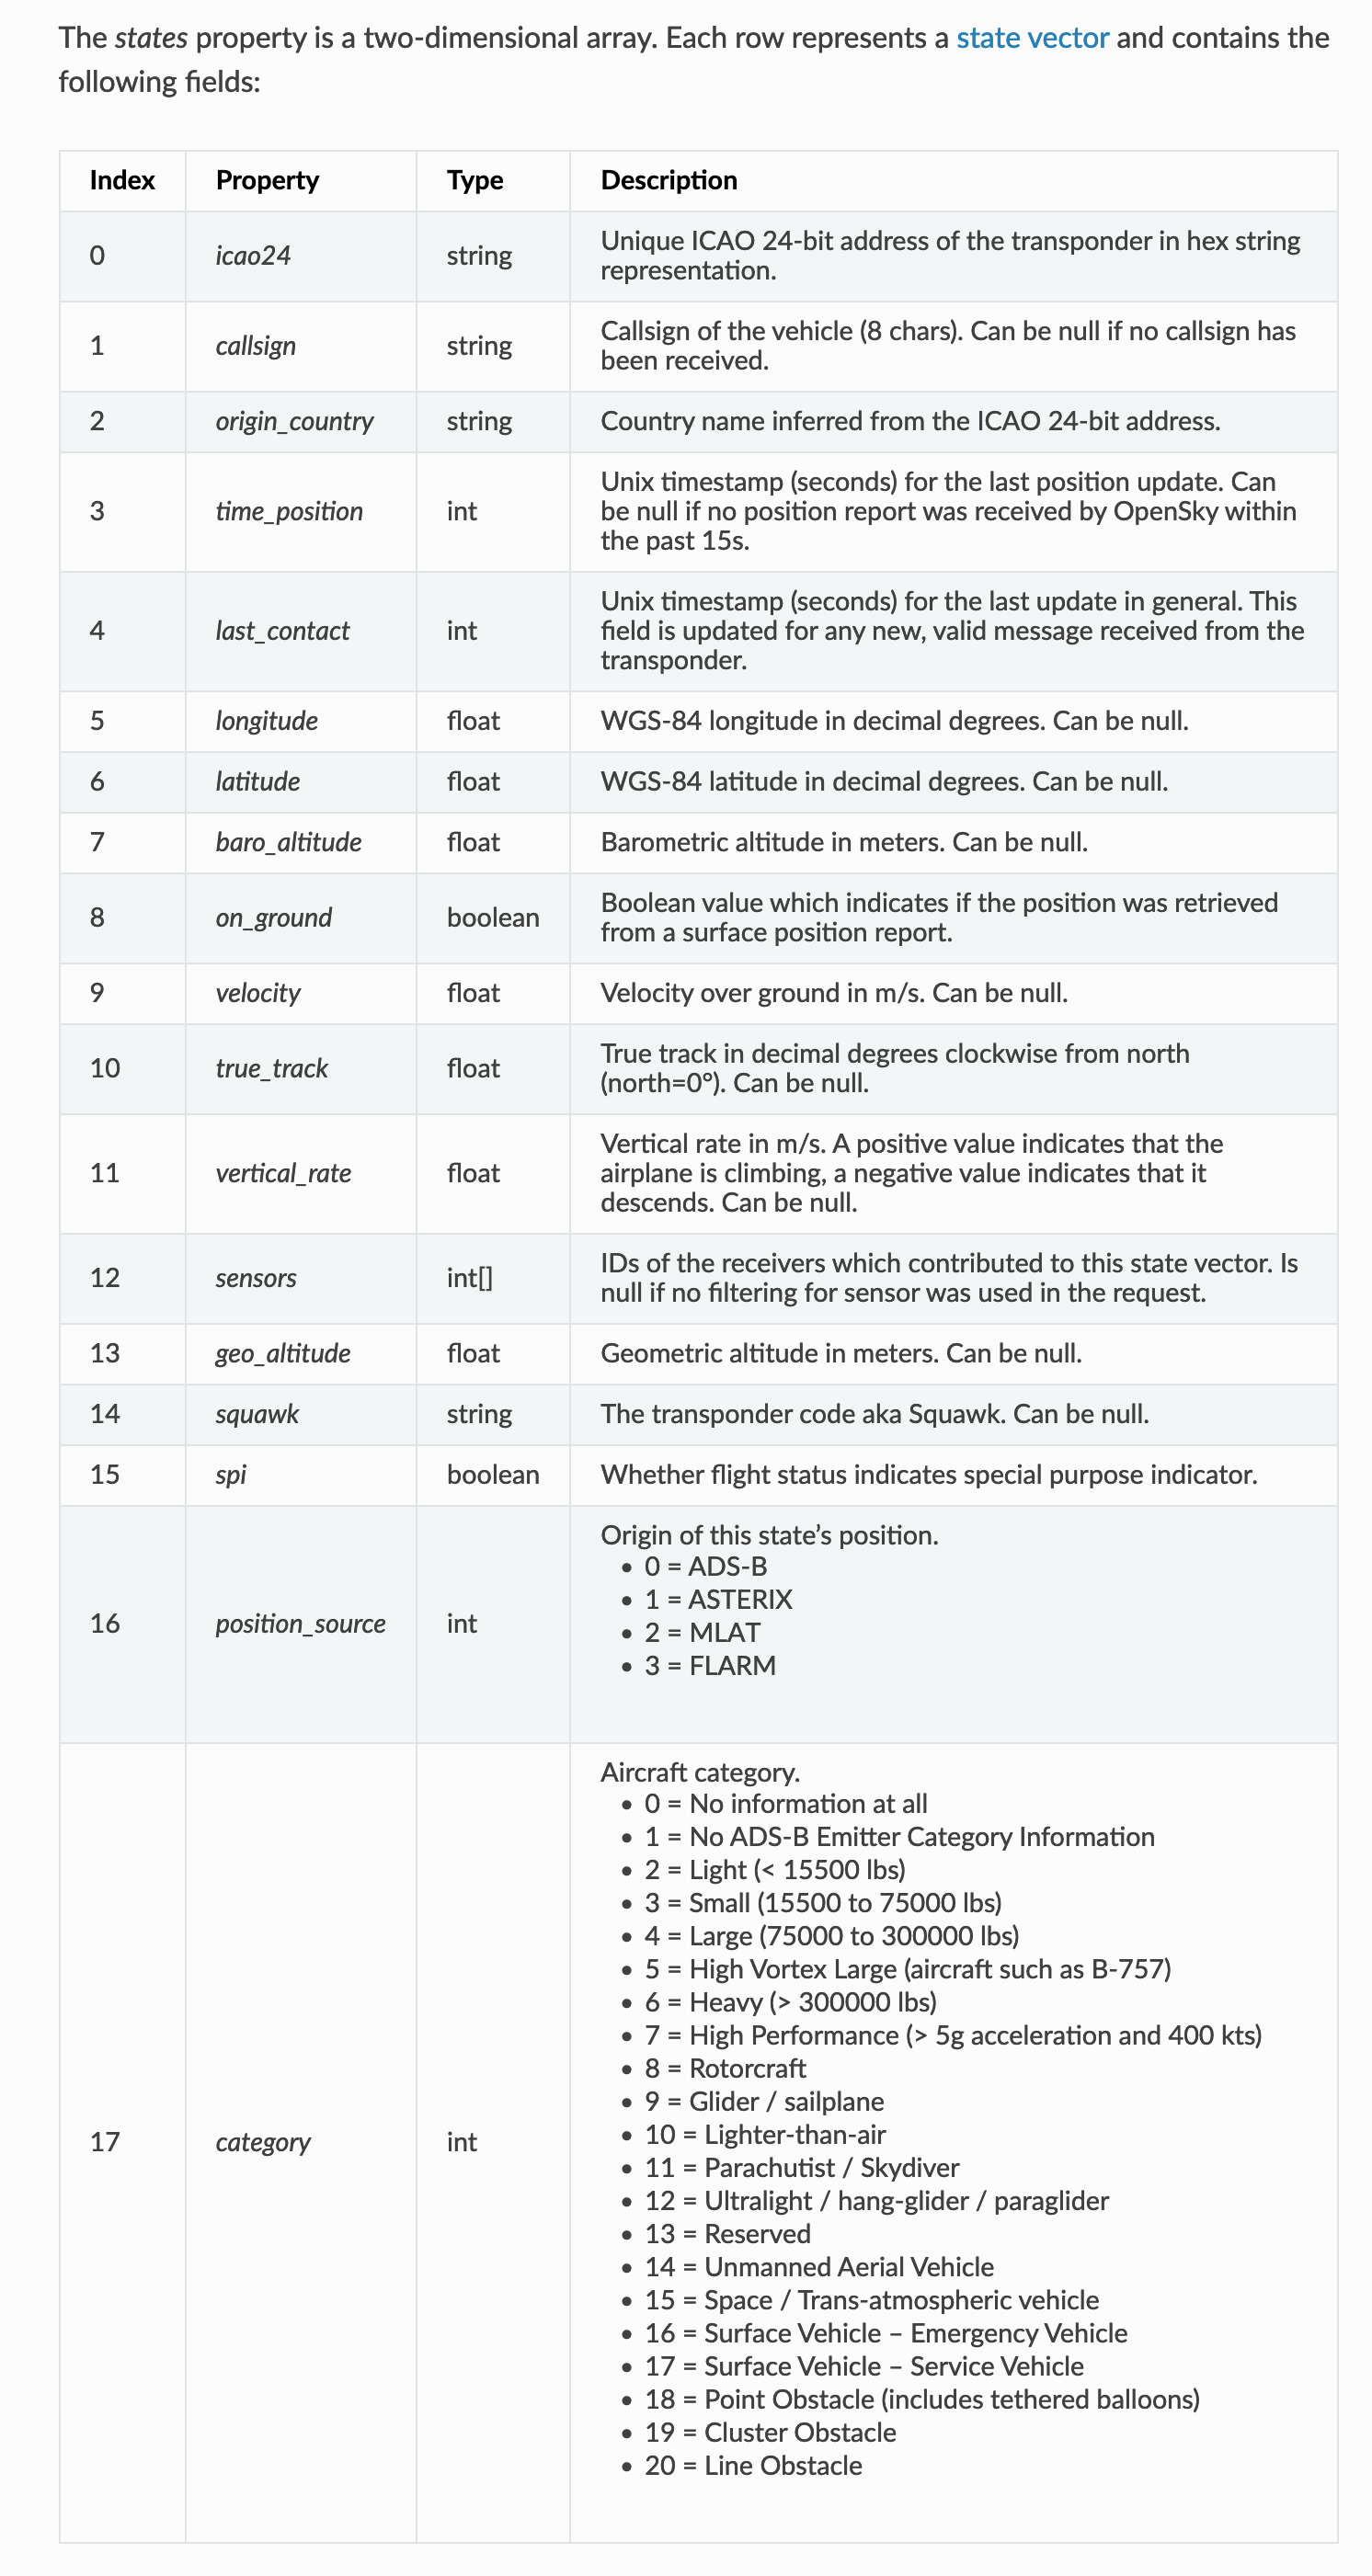
OpenSky State Vector Fields
To help decode all of the other fields we are seeing in the API response, we can return to OpenSky’s documentation and see that the states array contains a set of state vectors, which feature the following datapoints:
Helper Functions
To do a bit more processing of the API response, enabling things such as “what cardinal direction is that track?” and “how far away is that plane from my location?”, we need to set up a few helper functions.
Function to Compute Distance Between Two Coordinates
By defining a function which computes the Haversine Formula, we can easily do quick-and-dirty math to know how far apart two coordinates are along the surface of the earth.
from math import sin, cos, sqrt, atan2, radians

# Returns distance between points in miles
def get_haversine_distance(lat1, lng1, lat2, lng2):

  # Approximate radius of earth in km
  R = 6373.0

  lat1 = radians(lat1)
  lon1 = radians(lng1)
  lat2 = radians(lat2)
  lon2 = radians(lng2)

  dlon = lon2 - lon1
  dlat = lat2 - lat1

  a = sin(dlat / 2)**2 + cos(lat1) * cos(lat2) * sin(dlon / 2)**2
  c = 2 * atan2(sqrt(a), sqrt(1 - a))

  distance = R * c

  return round(distance / 1.609, 1)
Function to Compute Bearing
To answer the question “what direction is the plane from my current location?” we will define a function that computes the relative bearing between any two coordinates.
from math import cos, radians, sin, atan2, degrees

# Returns the bearing between two coordinates in degrees from the north
def get_bearing(lat1, long1, lat2, long2):
    dLon = (long2 - long1)
    x = cos(radians(lat2)) * sin(radians(dLon))
    y = cos(radians(lat1)) * sin(radians(lat2)) - sin(radians(lat1)) * cos(radians(lat2)) * cos(radians(dLon))
    brng = atan2(x,y)
    brng = degrees(brng)

    return (brng + 360) % 360
Function to Convert Numeric Heading to Compass Direction
This function does the ugly work of translating a numeric track into a human-readable heading:
ie. not 230.8, but SW
def get_heading(value):
  heading = ""

  if value < 11.25:
    heading = "N"
  elif value < 33.75:
    heading = "NNE"
  elif value < 56.25:
    heading = "NE"
  elif value < 78.75:
    heading = "ENE"
  elif value < 101.25:
    heading = "E"
  elif value < 123.75:
    heading = "ESE"
  elif value < 146.25:
    heading = "SE"
  elif value < 168.75:
    heading = "SSE"
  elif value < 191.25:
    heading = "S"
  elif value < 213.75:
    heading = "SSW"
  elif value < 236.25:
    heading = "SW"
  elif value < 258.75:
    heading = "WSW"
  elif value < 281.25:
    heading = "W"
  elif value < 303.75:
    heading = "WNW"
  elif value < 326.25:
    heading = "NW"
  elif value < 348.75:
    heading = "NNW"
  elif value >= 348.75:
    heading = "N"

  return heading
Script to Process State Vectors in API Response
With our helper functions defined, we can now loop over all of the items in the states array, and process the important bits of data we want to have for each airplane.
import string

YOUR_COORD = [LATITUDE, LONGITUDE]

output = []

for item in r.json()['states']:
  temp = {}

  temp['callsign'] = item[1].strip()
  temp['origin_country'] = item[2]
  temp['lng'] = item[5]
  temp['lat'] = item[6]
  temp['dist_from_you'] = get_haversine_distance(YOUR_COORD[0], YOUR_COORD[1], item[6], item[5])
  temp['location_vs_you'] = get_heading(get_bearing(YOUR_COORD[0], YOUR_COORD[1], item[6], item[5]))
  temp['speed'] = round(item[9] * 2.23694)  # converts meters/sec to miles/hour
  temp['track'] = item[10]
  temp['heading'] = get_heading(item[10])
  temp['climb'] = 'ascending' if item[11] > 0.5 else 'descending' if item[11] < -0.5 else 'stable'
  temp['altitude'] = round((item[13] or item[7]) * 3.28)  # converts meters to feet
  temp['category'] = 'H' if item[17] == 6 else 'L' if item[17] == 5 else 'M' if item[17] == 4 else 'S' if item[17] == 4 else '-'

  output.append(temp)
Print Out State Vectors in Ascending Order of Distance
This final snippet of code will print our list in ascending order of distance!
for d in sorted(output, key=lambda i: i["dist_from_you"]):
  for k, v in d.items():
    print(k, ': ', v, sep = '')
With it, we can finally get the full sense of what was happening with Southwest Flight 3275: it was heading North at an altitude of 38,615 feet when it passed us, and was only 1.9 miles to the East when it did so!
callsign: SWA3275
origin_country: United States
lng: -118.4627
lat: 34.0271
dist_from_you: 1.9
location_vs_you: E
speed: 480
track: 349.09
heading: N
climb: ascending
altitude: 38615
category: -
Next Steps
When I have some more time, I plan to take this code and build out a view for my Tidbyt smart display which shows these data points in an appealing snapshot view… I’m excited about having this in the rotation and getting to see the unique traffic from all over the world flowing into LAX!