I’ve got a long-running project in the works which involves temperature sensors that I’ve deployed in a number of locations in Santa Monica. Earlier today, it came time to finally go recover those temperature sensors - I wanted to share a little tool I made to make the job quick and easy!
The Task
When I put out the sensors, snapping a quick photo was all I did to track their location. I knew that iPhones record the locations where photos are taken, by default, and assumed I would probably just flip through and manually transcribe the list of coordinates when it came time to retrieve the sensors.
Better than that, though, I built a quick script to iterate through the photos, extract their latitude and longitude, and make a quick map of the points.
Take a peek below to see how I was able to do this using EXIF data and Leaflet maps in R - this will be a super light post, but I thought it was a fun capability to share.
Processing EXIF Data from a Directory of Images
library(exifr)
library(tidyverse)

# specify the image directory
image_dir <- "photos"

# fetch all .jpeg files and read their exif_data
exif_data <- read_exif(list.files(image_dir, pattern = "\\.jpeg$", full.names = TRUE))

# Filter relevant columns for latitude and longitude
gps_data <- exif_data %>%
  select(SourceFile, GPSLatitude, GPSLongitude)
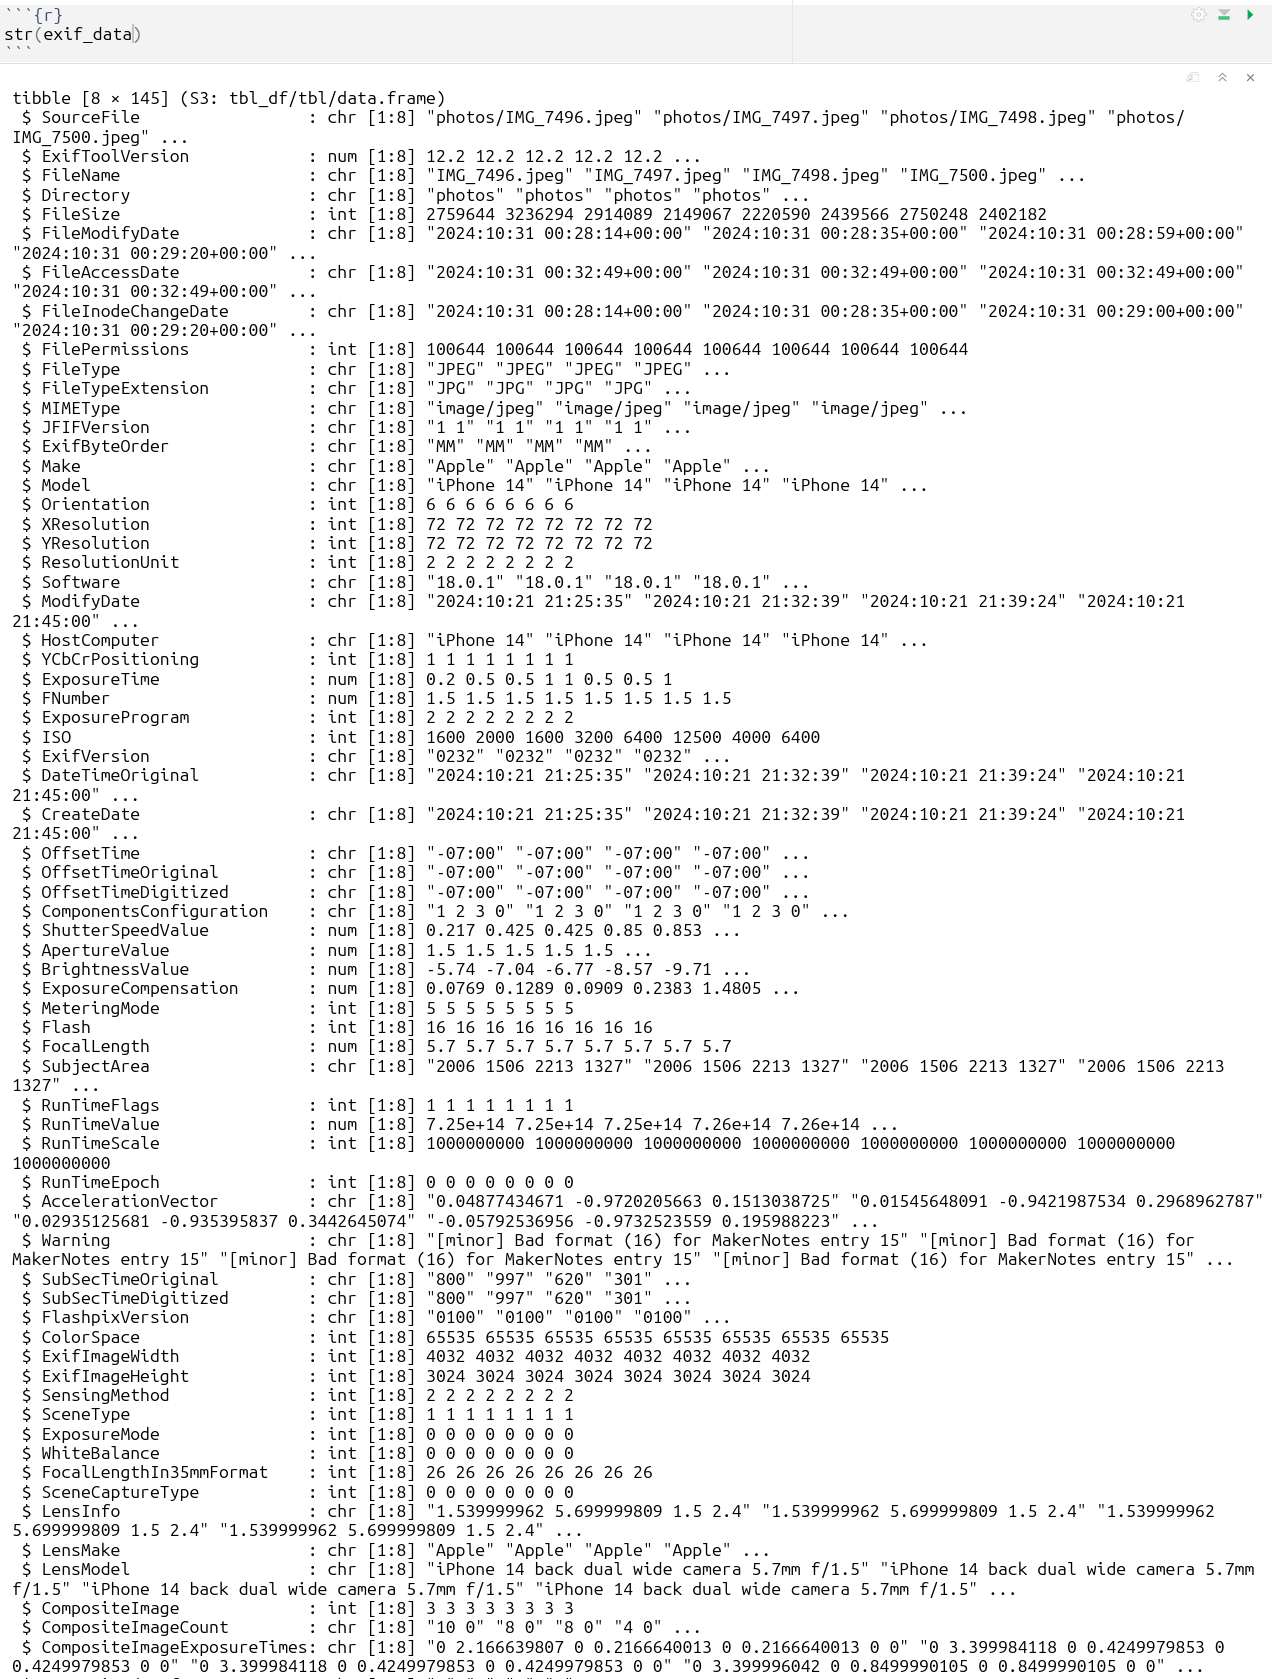
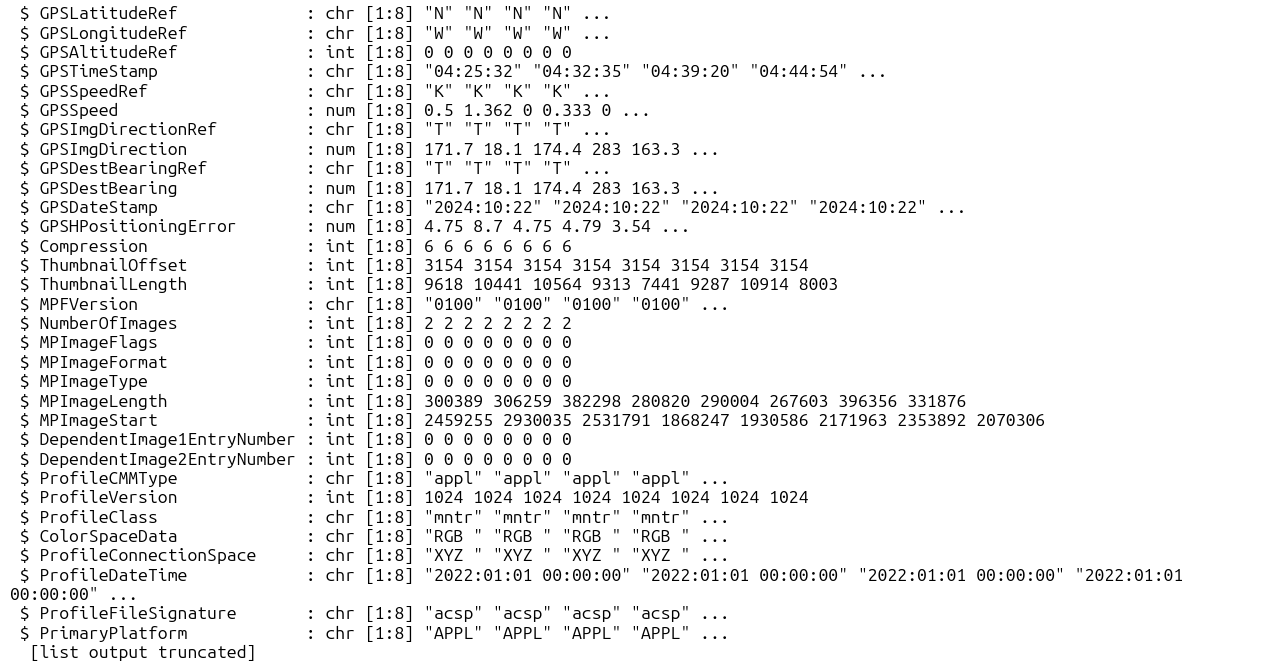
As you can see from the handful of lines of code above, the exifr package makes the job we want to do really easy - allowing us to specify a directory of images to iterate over, reading the EXIF tags, and loading the details into a dataframe.
Note that the exif_data dataframe has a huge amount of data about each image which you can extract if desired - everything from metadata about the camera type being used and location to image-specific details like exposure, size, and aperture.
I just needed the latitude and longitude for this task, but it’s cool to see how easy it is to extract all these details across a large volume of images.
Sensor Map
With those lat/lng coordinates loaded, it was easy to build a map that I could use to orchestrate my retrieval efforts - peep the code below which uses leaflet to provide the basemap, and then adds circle markers at each location.
There will be more detail to come in future blog posts on the temperature data I was collecting - in the meantime, hope this is a helpful resource if you ever need or want to interact with EXIF data in the future!
Code to Implement
# Add labels for mapping
gps_data$label <- list(
  "Ocean and San Vicente #2",
  "4th and San Vicente",
  "Ocean and San Vicente #1",
  "9th and San Vicente",
  "14th and San Vicente",
  "21st and San Vicente",
  "Avondale and San Vicente",
  "Gretna Green Way and San Vicente"
)
gps_data$recovered <- list(FALSE, TRUE, TRUE, TRUE, TRUE, TRUE, FALSE, FALSE)

library(leaflet)

# Create basemap with leaflet and add colored markers
l <- leaflet(gps_data) %>%
  addTiles() %>%
  addCircleMarkers(
    ~GPSLongitude, ~GPSLatitude,
    color = ~ifelse(recovered, "green", "red"),
    opacity = 0.6,
    fillOpacity = 0.4,
    popup = ~paste("<b>", label, "</b>", "<br>(", round(GPSLatitude, 4), ", ", round(GPSLongitude, 4), ")", "<br>Recovered: ", recovered)
  ) %>%
  setView(lng = mean(gps_data$GPSLongitude), lat = mean(gps_data$GPSLatitude), zoom = 13) %>%
  addLegend(
    position = "bottomright",
    colors = c("green", "red"),
    labels = c("Recovered", "Not Recovered"),
    title = "Sensor Status"
  )

library(htmlwidgets)

# export .html to embed map
saveWidget(l, file="map_temp_sensors.html")