Earlier this fall, I entered into a machine learning contest to predict plane take-off weights, organized by the Opensky Network, an aviation group. A week or two ago, I finished a write-up of the final model I built for the competition, overviewing the approach I used to engineer features and train and test my model.
Since finishing that post, I’ve been excited to point my attention to a planned follow-up post: understanding what the winning submissions did to outperform everyone else!
Overview
While building my model, I knew there were features or modeling approaches I was missing. I was able to find a few of them by talking with friends, reading literature, and bouncing my model off of ChatGPT, but there were clearly a few RMSE-optimizing tricks which I was never able to put a finger on, yet the winning teams knew to include.
This post is designed to put a finger on some of those methods, by reviewing the open-source code submitted by each group and documenting some learnings on what each team did uniquely well.
Here were the top three teams in the challenge, which we will focus our study on (keep in mind my model’s RMSE was 2,695):
| Rank | Team Name | Contributors | RMSE | Model Type | Code and Documentation |
|---|---|---|---|---|---|
| 1 | Team Likeable Jelly | Professors at Ecole Nationale de l’Aviation Civile (ENAC), Toulouse, France | 1561 | LightGBM | Repository |
| 2 | Team Faithful Engine | Hobbyists | 1635 | Autogluon | Repository |
| 3 | Team Likeable Jelly | Professors and graduate students affiliated with the Aeronautics Institute of Technology (ITA) in Brazil | 2218 | Ensemble of Tree-Based Models | Repository |
Team-by-Team Insights
Team Likeable Jelly
Model
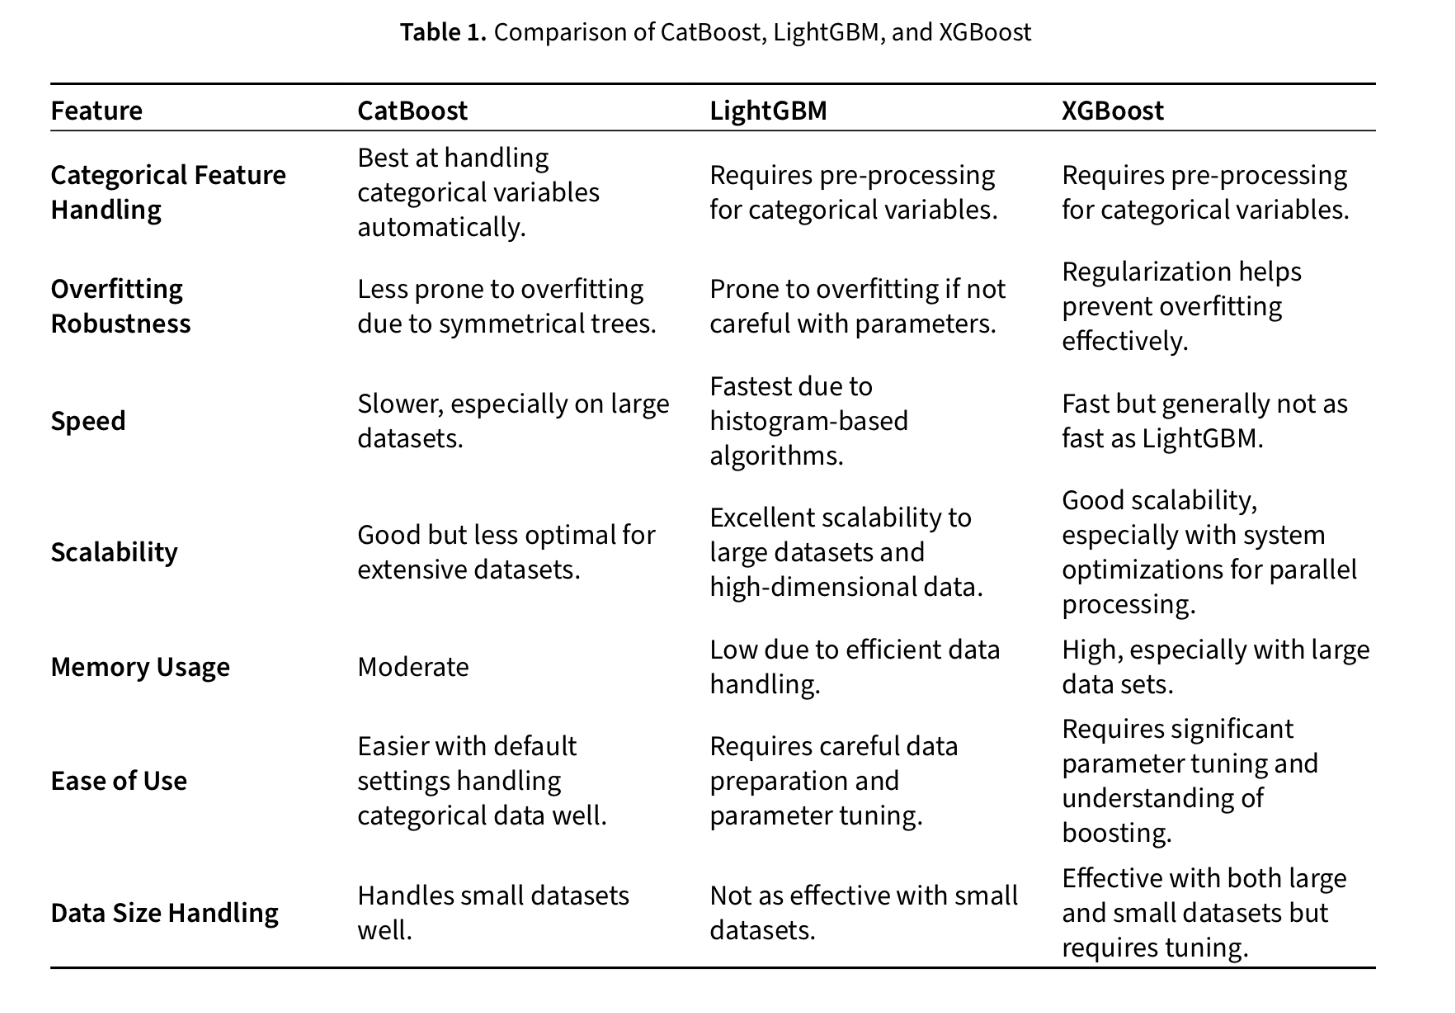
Used LightGBM as the the modeling framework, a Microsoft-created bit of software which uses gradient-boosted decision trees. In practice, LightGBM is a bit faster and more accurate than the random forest model I used, but at the cost of some transparency, as features importance can no longer be trivially derived, as it can be from a random forest.
Features
This team created and used two fully new sets of features:
- Physics-based Plane Performance Data: used the OpenAP Python library to model plane performance, fuel consumption, and then mass at a variety of points along each flight trajectory
- Arrival Weather Data from METAR: pulled in external data about weather conditions at destination airports to account for flights which might have to adjust their flight patterns or hold upon arrival, thereby impacting the required amount of takeoff fuel
Physics-Based Plane Performance
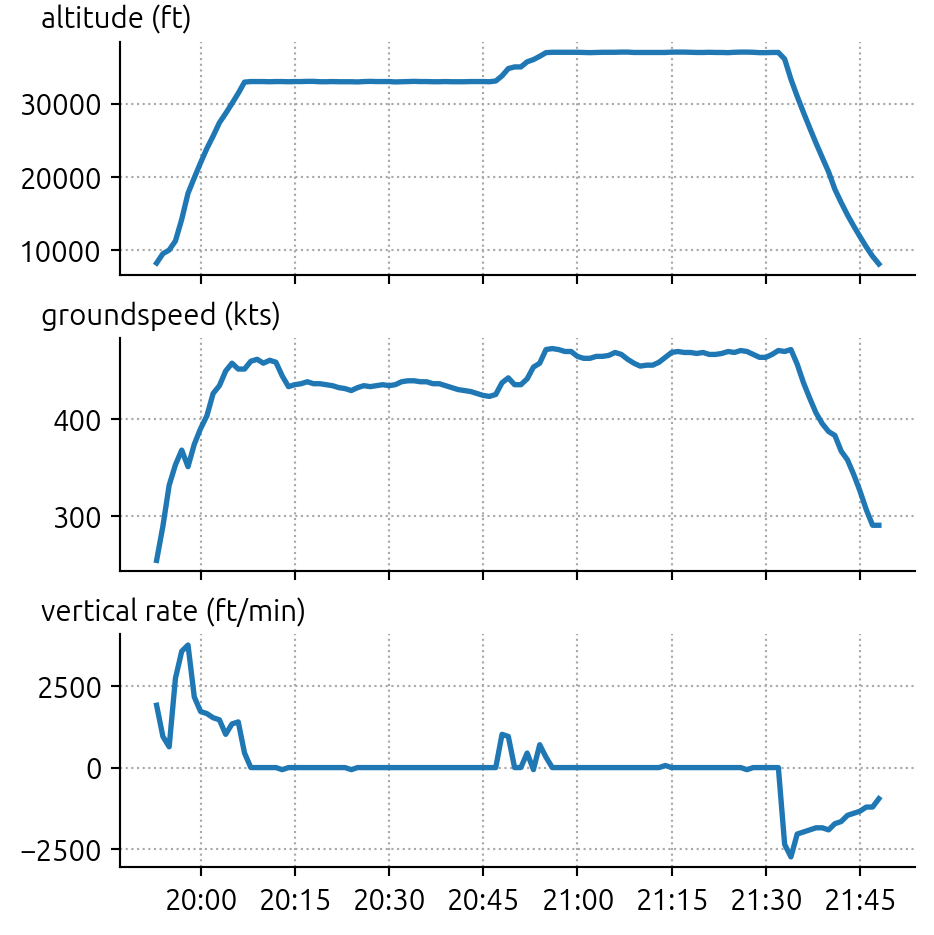
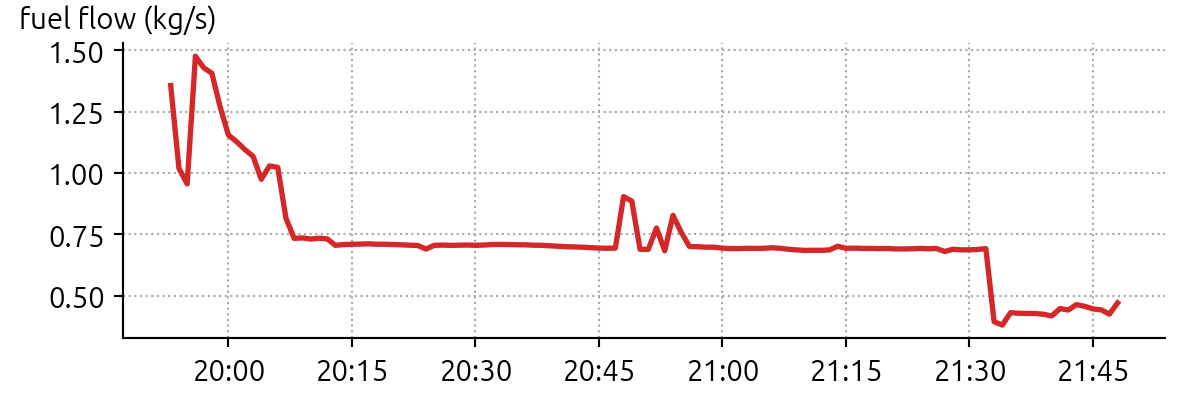
Probably the coolest thing I learned through this exercise was the existence and capabilities of the OpenAP library. Open-source software published by Junzi Sun at the Delft University of Technology, OpenAP makes it actually quite easy to estimate things like fuel consumption rate along the path of a flight.
Using the detailed flight trajectories provided in the challenge, this team created FuelFlow models for each aircraft type, and then sampled the trajectory data to compute snapshots of the fuel burn over the flight. Then, they took the area under the curve and derived a good estimate for the total fuel burn for the full flight. With that data, and knowledge of the unloaded weight of the aircraft, they were able to derive a much better estimate of the actual takeoff weight of the plane.
OpenAP can be used for other feature engineering purposes as well, with modules like FlightPhase available which are able to create phase-of-flight classifications based on ADS-B trajectory data.
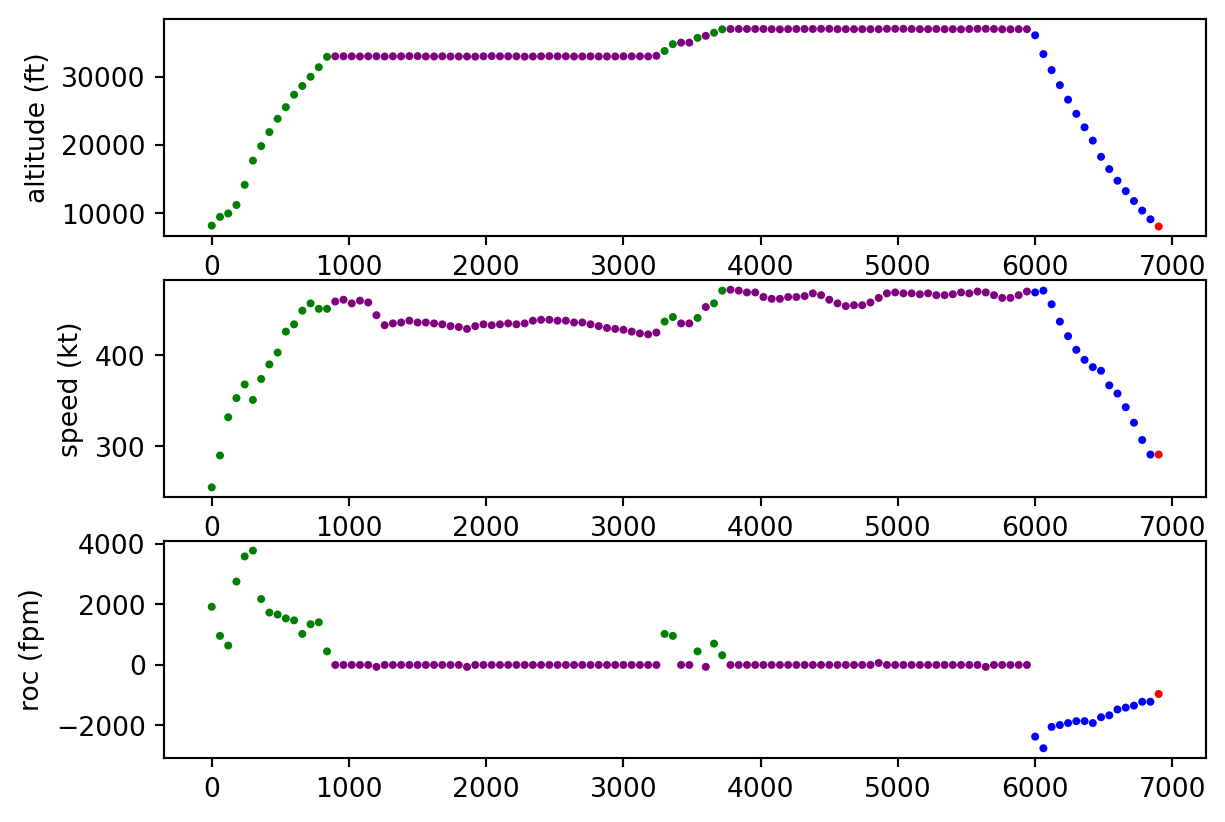
Ultimately, this team did an awesome job knowing the OpenAP library was available, harnessing its power, and using it as a valuable input into their TOW model - allowing them to extract significantly more useful “signal” from the trajectory data than I was with my time-in-phase and altitude/groundspeed/rate of climb summary statistics.
Arrival Weather Data from METAR
This team had the smart realization that arrival airport weather conditions are a meaningful factor for determining TOW, as planes may need to take off with more fuel if they believe they may have to loiter on station prior to landing, due to storms or other adverse weather.
To build a feature for this, they pulled in METeorological Aerodrome Report (METAR) data to understand weather conditions at destination airports, which holds information on temperature, wind, precipitation, and more.
The team did a spatial/temporal clustering of airports and times so that the most relevant METAR reports could be attributed to each flight, since the data completeness and latency varied across all of the airports in scope.
I thought this was a great idea, and probably more meaningful than my simple inclusion of temperature and humidity percentiles along the total path of the flight - the domain knowledge of these participants told them it’s specifically the weather at the arrival airport that matters, and that factors like wind, precipitation, and visual range are the most meaningful factors.
Methodological Notes
- Fitted cubic splines (using csaps) to the trajectory data to remove some of the variance and resampled the data to remove isolated points
- Identified and removed some incorrect timestamps and replaced them with buffered estimates based on flight phase: a great idea, I didn’t realize some of the timestamps were bad!
- Created 1,000 foot altitude buckets and generated features like rate of climb, OpenAP estimated mass, and energy consumption rate for each altitude band
- Divided each flight into twenty slices of time (each representing 5% of the flight duration) and engineered time-based features on each of those slices
- Modeled a different target variable than just TOW. Instead, the team modeled
(TOW - EOW) / (MTOW - EOW), which you can think of asPayload Weight / Maximum Payload Weight, which is really just a ratio statistic for “Load %”. With this approach, the team would calculate that a given flight might be 87.5% laden, which would then be converted into a raw TOW with knowledge of the aircraft model and it’s MTOW
Team Faithful Engine
Similar to Team Likeable Jelly, this team also pulled in METARS for destination airport weather and used the trajectory data to estimate fuel usage!
Like me they didn’t know about OpenAP, but unlike me they definitely did know about Acropole, another really cool Python library! Acropole allowed them to build a fuel usage estimator for each flight which consumed trajectory data (once resampled to a 4 second rate) and output estimated consumption data.
import pandas as pd
from acropole import FuelEstimator

fe = FuelEstimator()

flight = pd.DataFrame({
    "typecode": ["A320", "A320", "A320", "A320"],
    "groundspeed": [400, 410, 420, 430],
    "altitude": [10000, 11000, 12000, 13000],
    "vertical_rate": [2000, 1500, 1000, 500],

    # optional features:
    "second": [0.0, 1.0, 2.0, 3.0],
    "airspeed": [400, 410, 420, 430],
    "mass": [60000, 60000, 60000, 60000]
})

flight_fuel = fe.estimate(flight) #flight.data if traffic flight
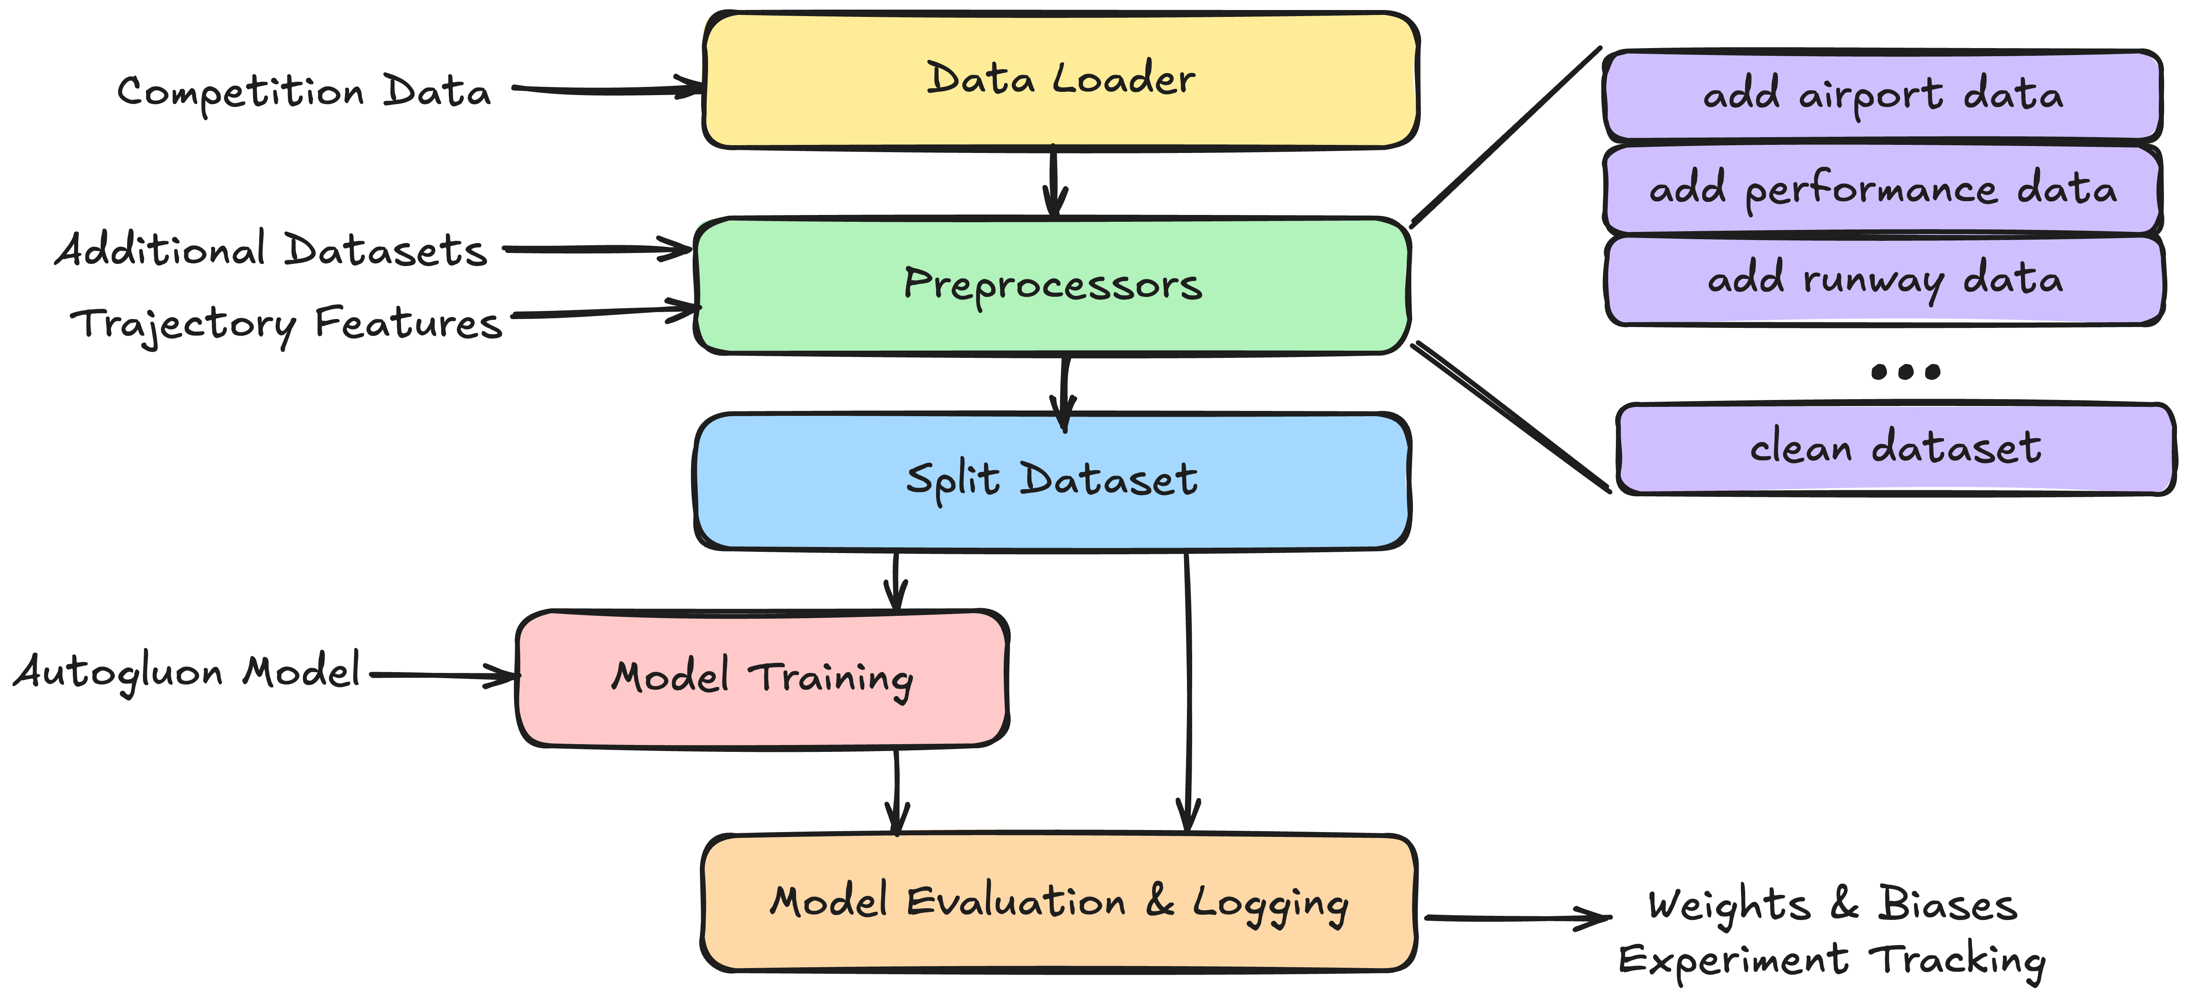
The other unique element of this team’s approach was a focus on AutoML methods - by throwing compute at the problem, they were able to abstract away the model selection and tuning stage of things, and focus their energy on feature engineering.
The Autogluon model they used would automatically select the framework (ie. XGBoost, Random Forest, etc.), hyperparameters, and features with the the best performance for them in each training cycle, allowing them to survey a variety of options and pick the RMSE-optimizing combination.
I didn’t go down this path because 1) I wanted to try to run all my modeling on my desktop computer at home, and 2) I’m cheap and didn’t want to pay for the cloud computer required to crunch all of the combinations of models! But I definitely thought about this as a potential optimization avenue and applaud Team Faithful Engine for choosing this approach and yielding such good model accuracy from it.
Team Tiny Rainbow
Finishing in third place was Team Tiny Rainbow, with an RMSE of 2,281 that was much closer to my team’s score of 2,695 than the winning team’s 1,561. As such, my review found that their model was actually quite similar: computing summary statistics per flight from the trajectories, pulling in external data on aircraft and airports, and transforming the flight statistics with transformations like binning, interaction variables.
Ultimately, I think their model outperformed mine by virtue of the ensemble approach they used, which pulled together outputs from CatBoost, LightGBM, XGBoost, and neural nets.
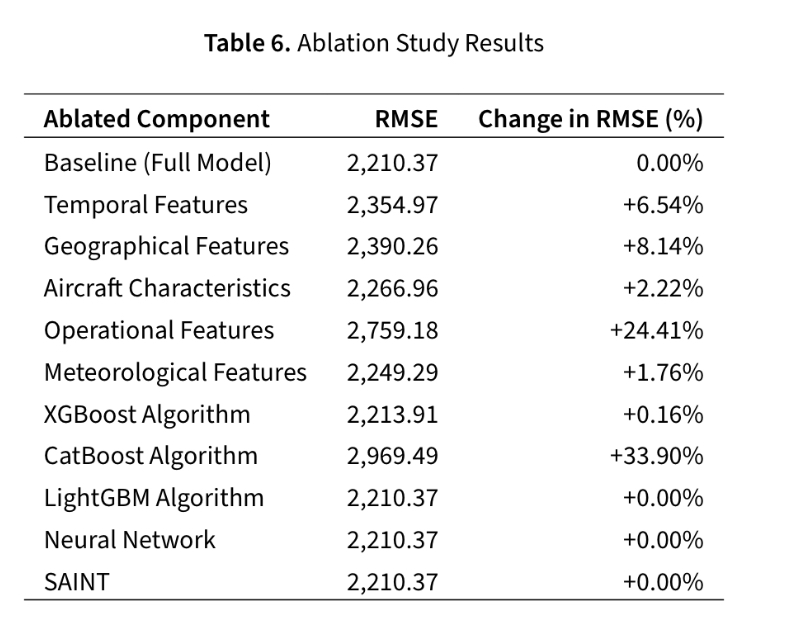
One element of their approach which I thought was particularly cool (documented in a working paper they’ve published) is an ablation study of their ensemble: a measurement of how much worse the accuracy of the ensemble gets if certain components are removed.
Because the model error increases significantly when the CatBoost algorithm is removed and when operational (ie. trajectory) data is removed, we can interpret those two elements as the most important elements of the ensemble - pretty cool!
In Conclusion
I’ve learned a ton from reviewing the submissions that outperformed me in the data challenge - the process of writing this post and the model review that it entailed has been extremely educational. I’m a big believer in the power of open source software as a tide that can lift all boats, and this challenge seems like a great example. Without it, I’d never have known that OpenAP and Acropole were super key tools for feature engineering trajectories, or how ablation studies can be conducted to understand the most impactful contributors to ensemble models.
I think I can hold my head high about my submission knowing that I was able to accomplish a lot with the data I did study, and in the future, I’m excited to apply some more of these techniques and tools!