On December 18th, the Senate Budget Committee dropped a doozy of a blog post, titled “New Data Reveal Climate Change-Driven Insurance Crisis is Spreading”.
They didn’t bury the lede at all, getting right to their conclusion that “climate change is increasing insurance non-renewals around the country” and that “the failure to deal with climate change is also affecting whether families can even get homeowners insurance”.
How I Found This Data
I wish I could say that I stumbled upon this post and the accompanying data as part of a research project. Unfortunately, that is not the case - I was turned onto this data in the aftermath of the enormous Palisades fire, which burned about 3 miles north of my house.
Here are a few photos I took on the first evening of the fire, standing on Adelaide Drive in Santa Monica and facing north into Rustic Canyon and the Palisades.
Video of Palisades Fire Burning Near Will Rogers State Park
Wide-Angle View of the Smoke Cloud
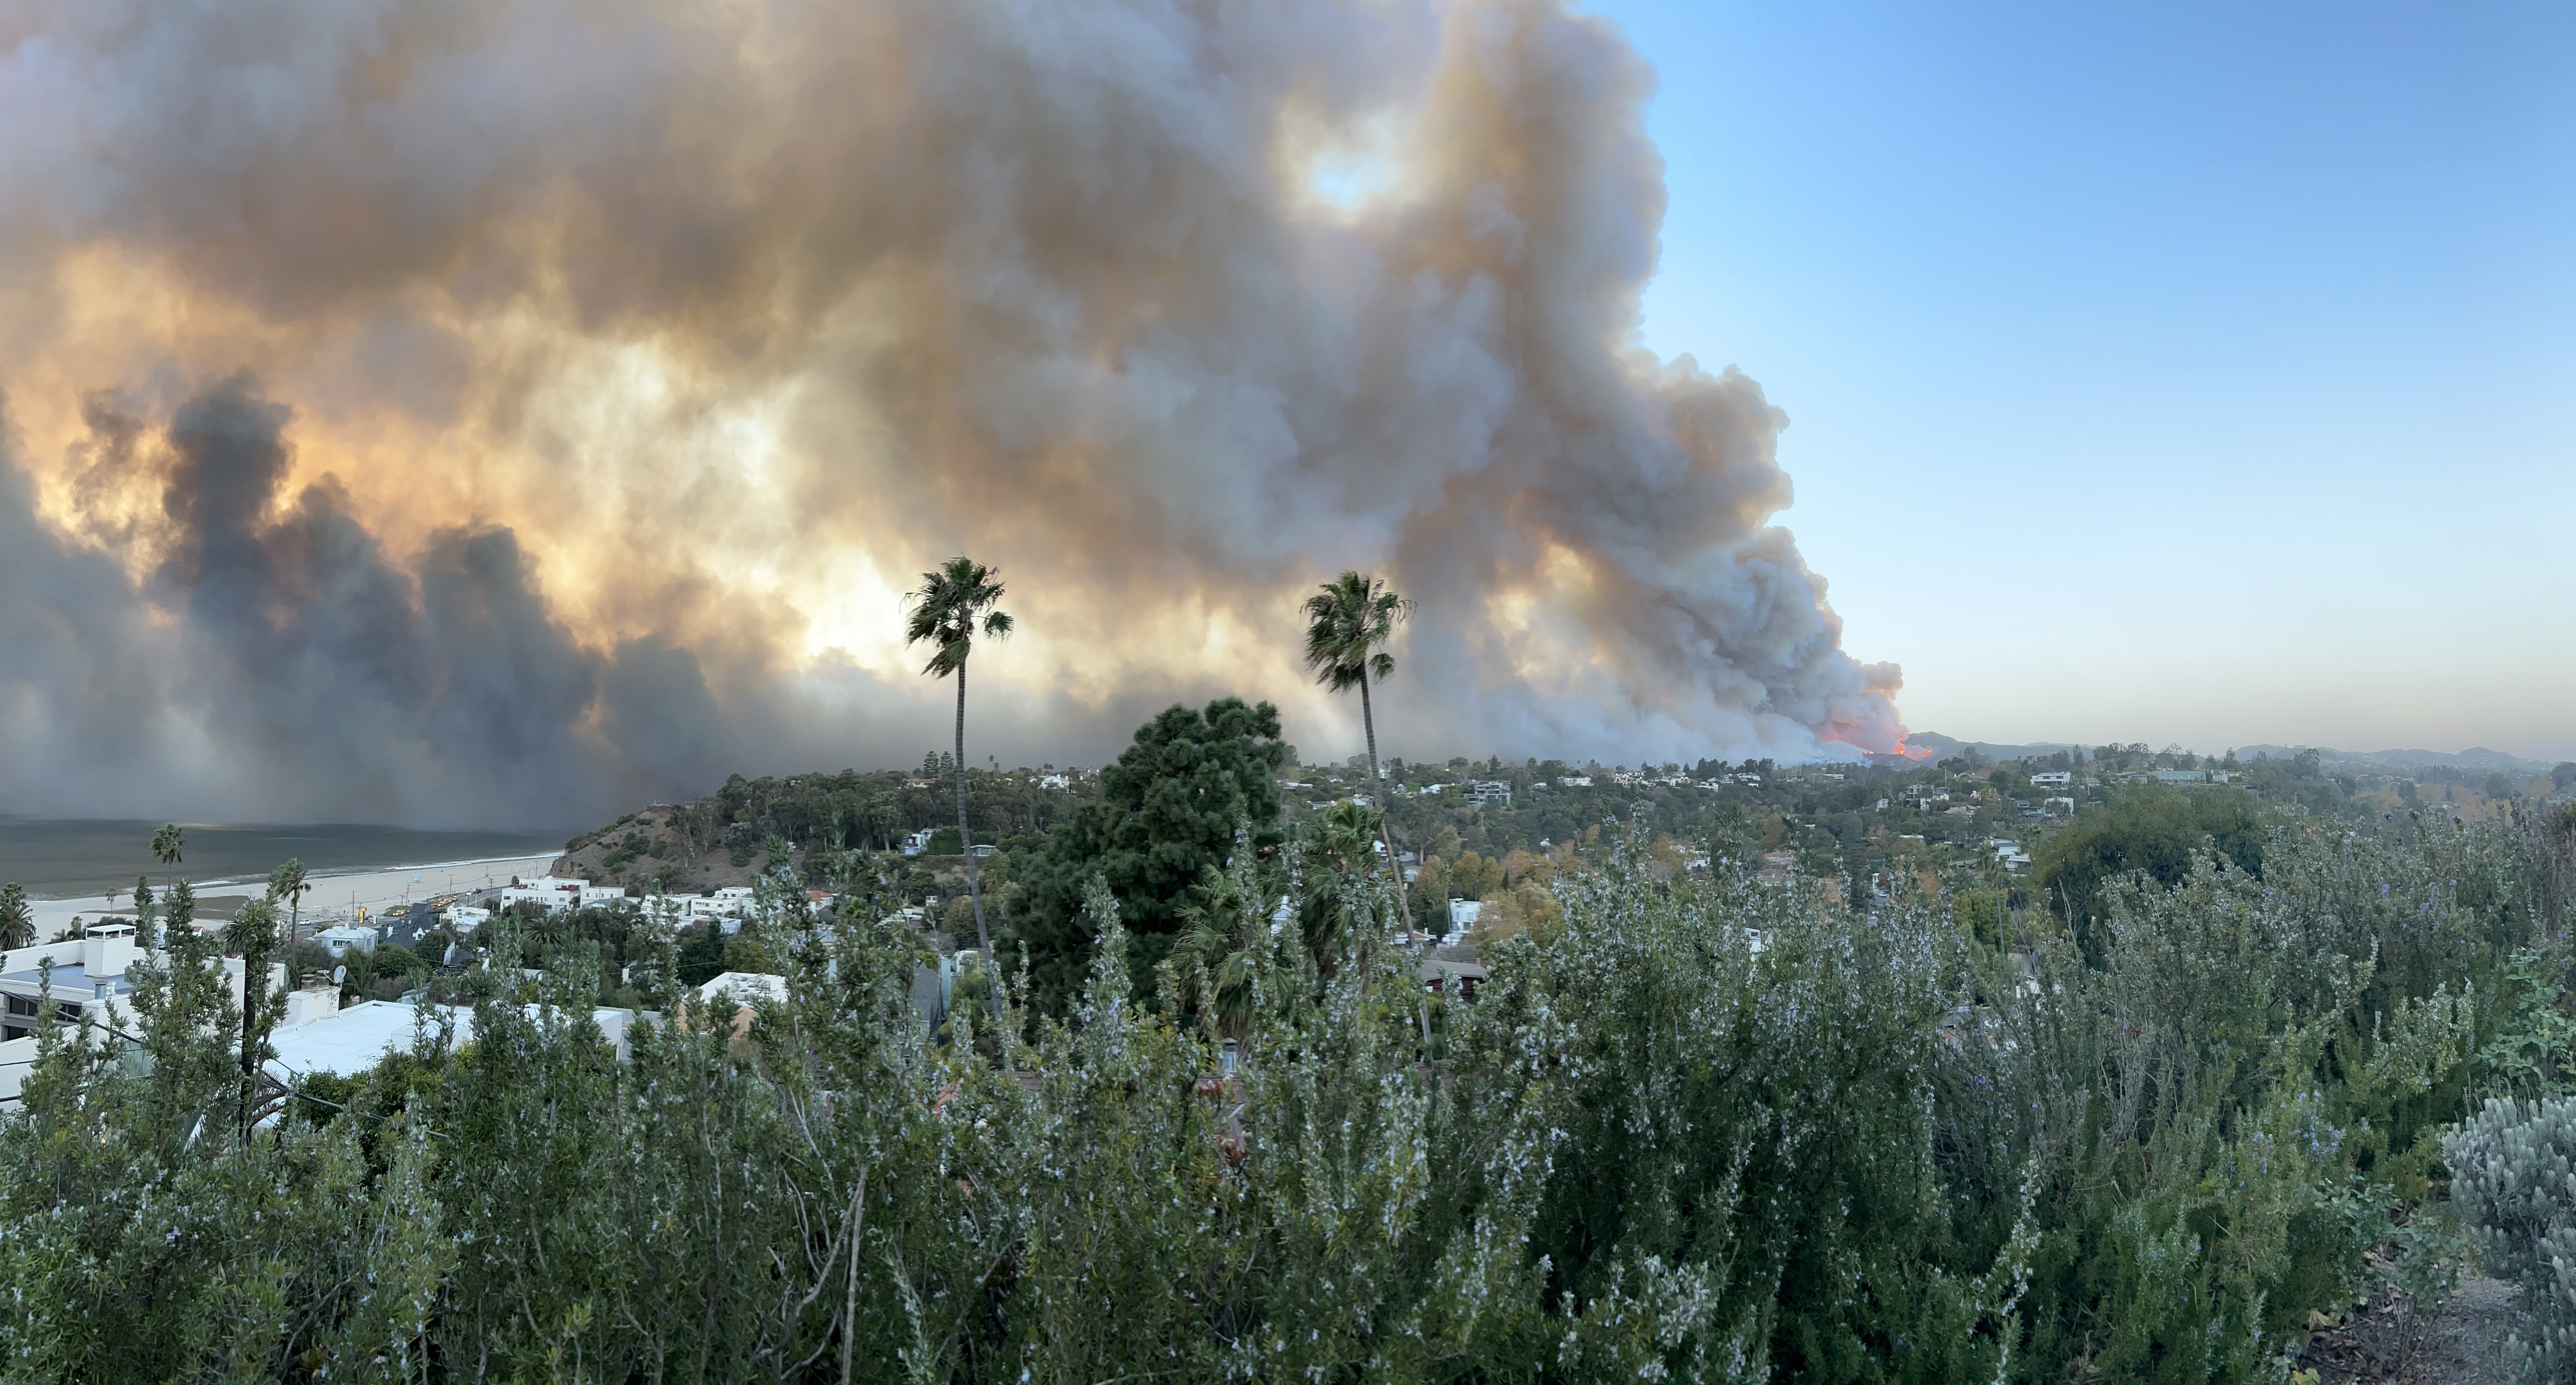
PCH Burning, as Seen from Santa Monica

Insurance Non-Renewal Maps
I’m acutely aware of how I lucky I was that the fire didn’t turn to the south and spread into Santa Monica. I also know, based on the unbelievable aerial footage shot during the burns, that vast swathes of the Palisades and Eastern Malibu weren’t so fortunate, with hundreds of businesses destroyed and thousands of homes in cinders.
With these losses in mind, I wanted to connect the insurance non-renewal story to the neighborhoods impacted by the Palisades fire, and then zoom out to take a look at the broader trend across the US.
Selected California ZIP Codes
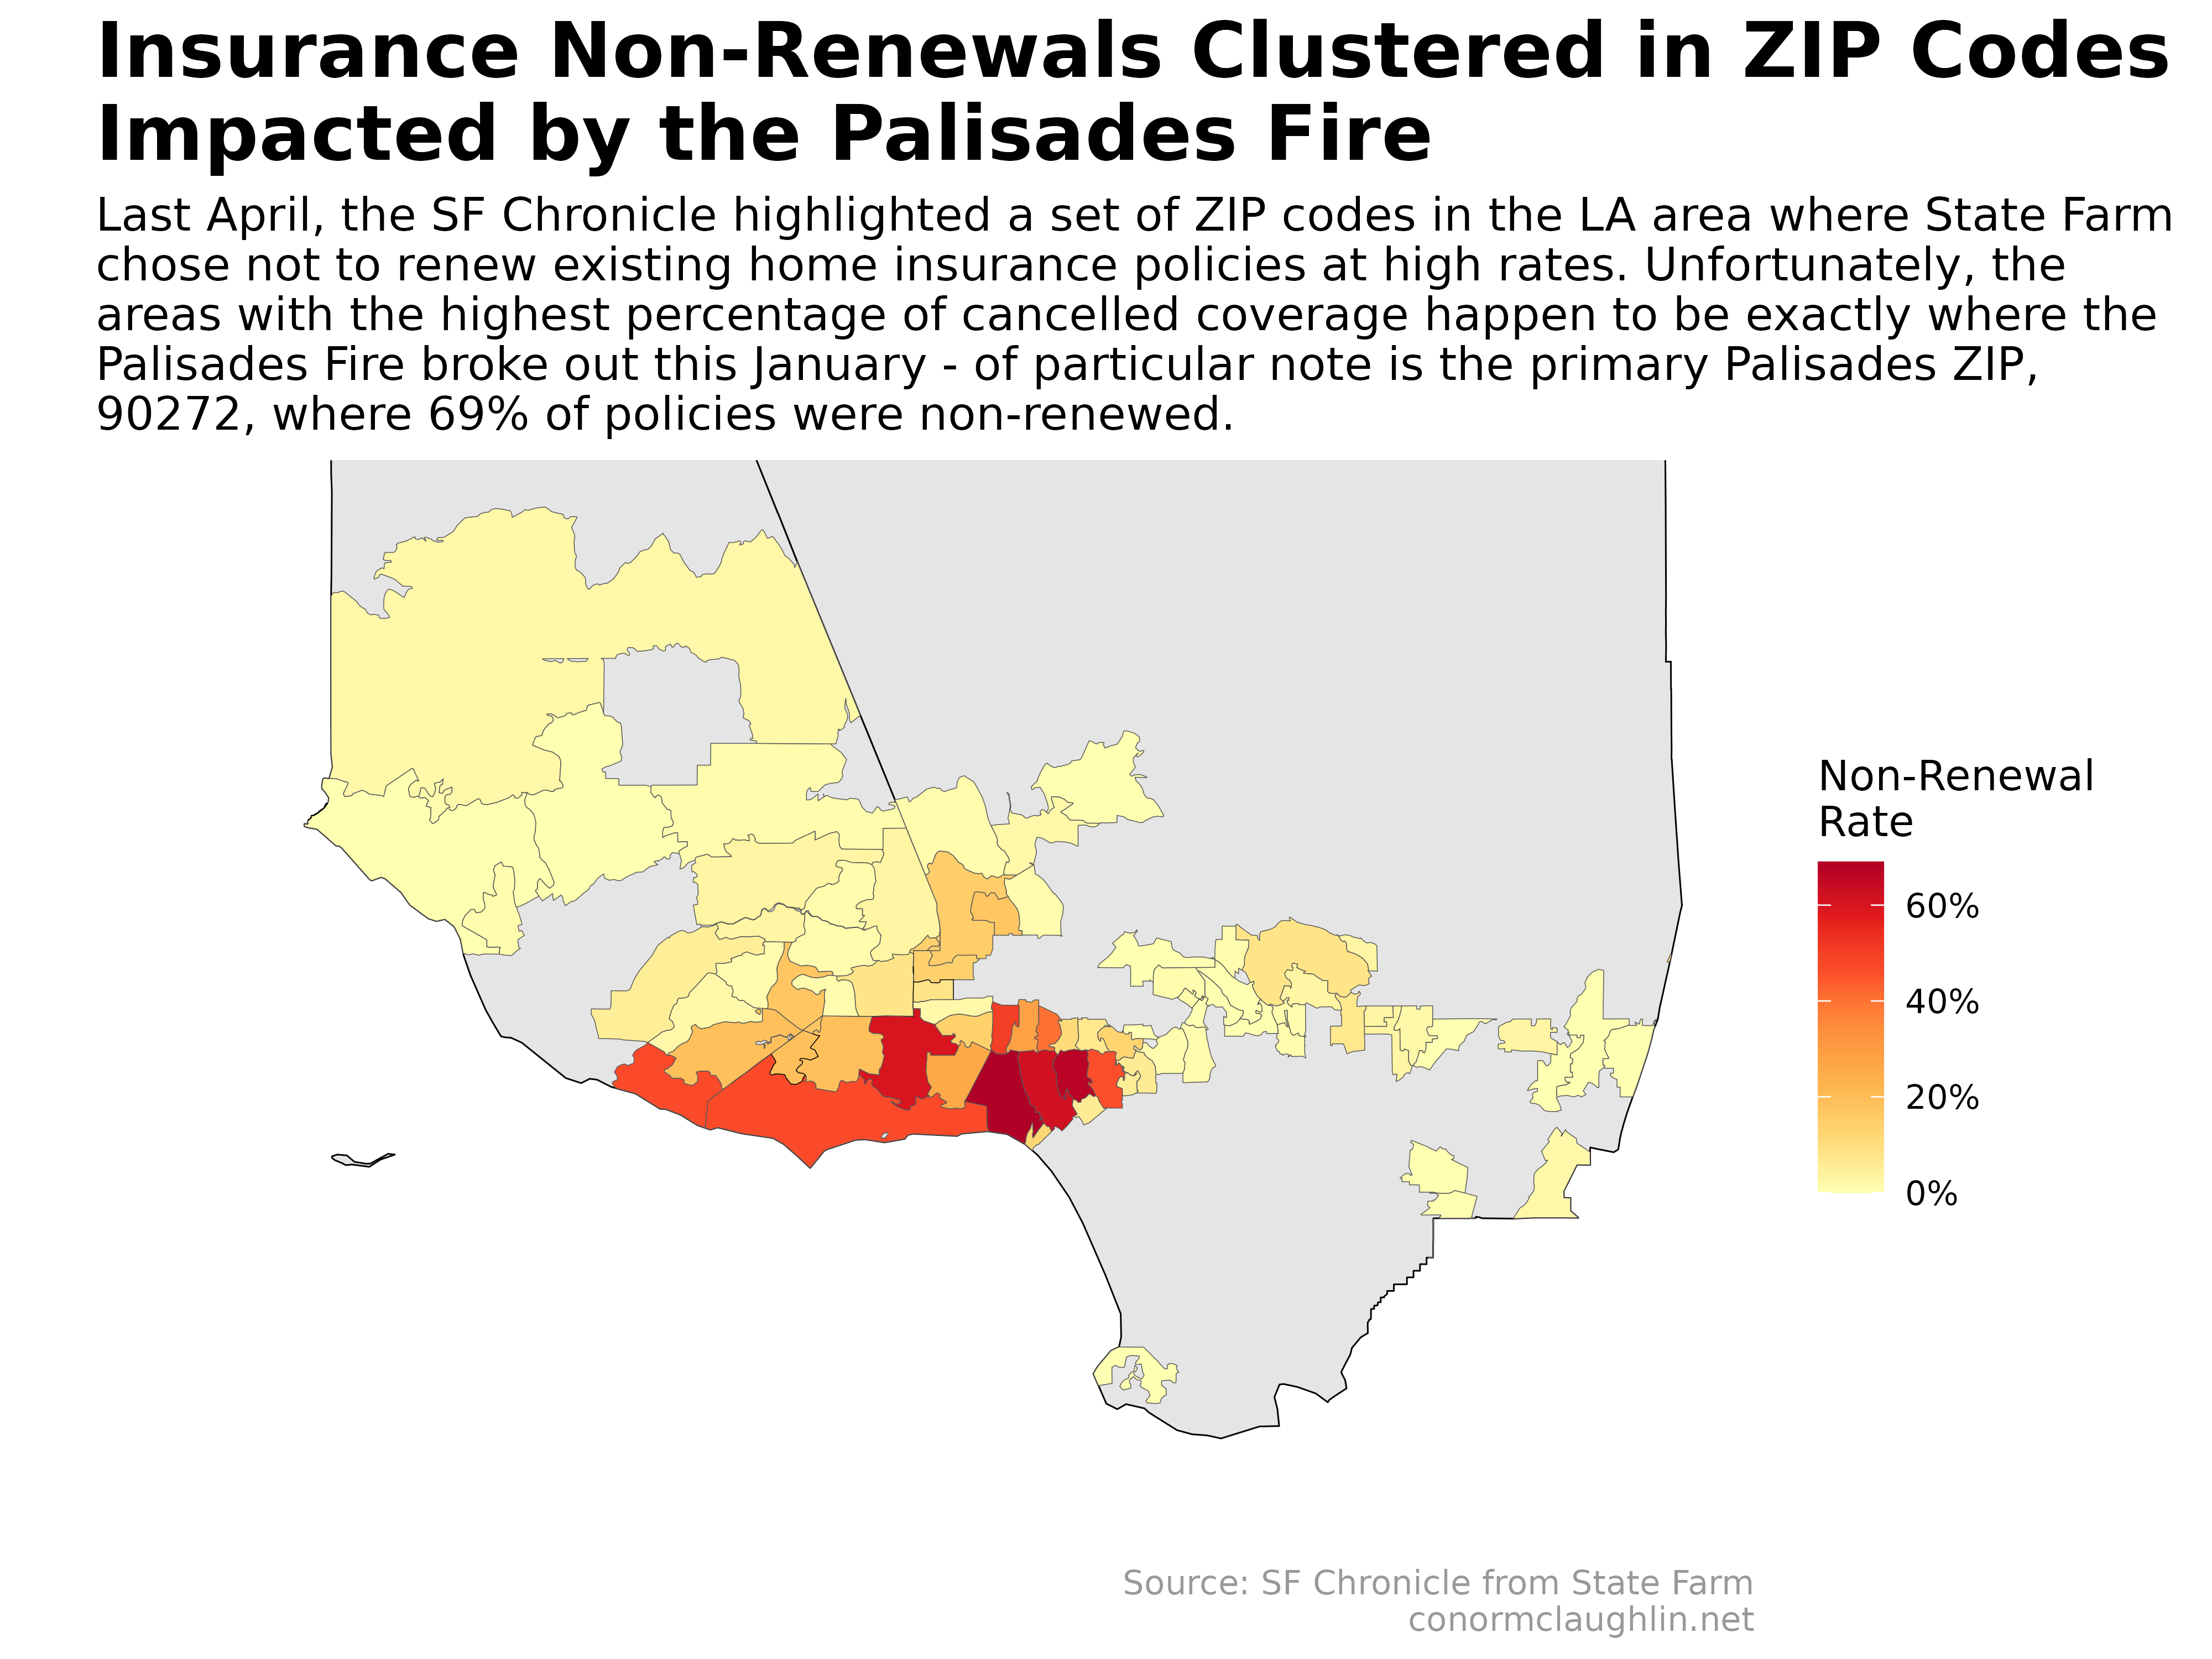
In April of 2024, the San Francisco Chronicle published an article highlighting a subset of California ZIP codes where State Farm chose not to renew home insurance policies. That decision heavily impacted the Pacific Palisades, which saw some of the highest non-renewal rates in the state. ZIP 90272, in particular, had 69% of policies non-renewed - a number that blew me away.
While this withdrawal may have made sense for State Farm’s financials - they judged they couldn’t charge a premium high enough (as they are regulated by CA law) to turn a profit in these ZIPs, so they left - it meant that thousands of families were left without coverage, or with only the California FAIR Plan to support them, a bare-bones policy of last resort.
Nationwide View by County
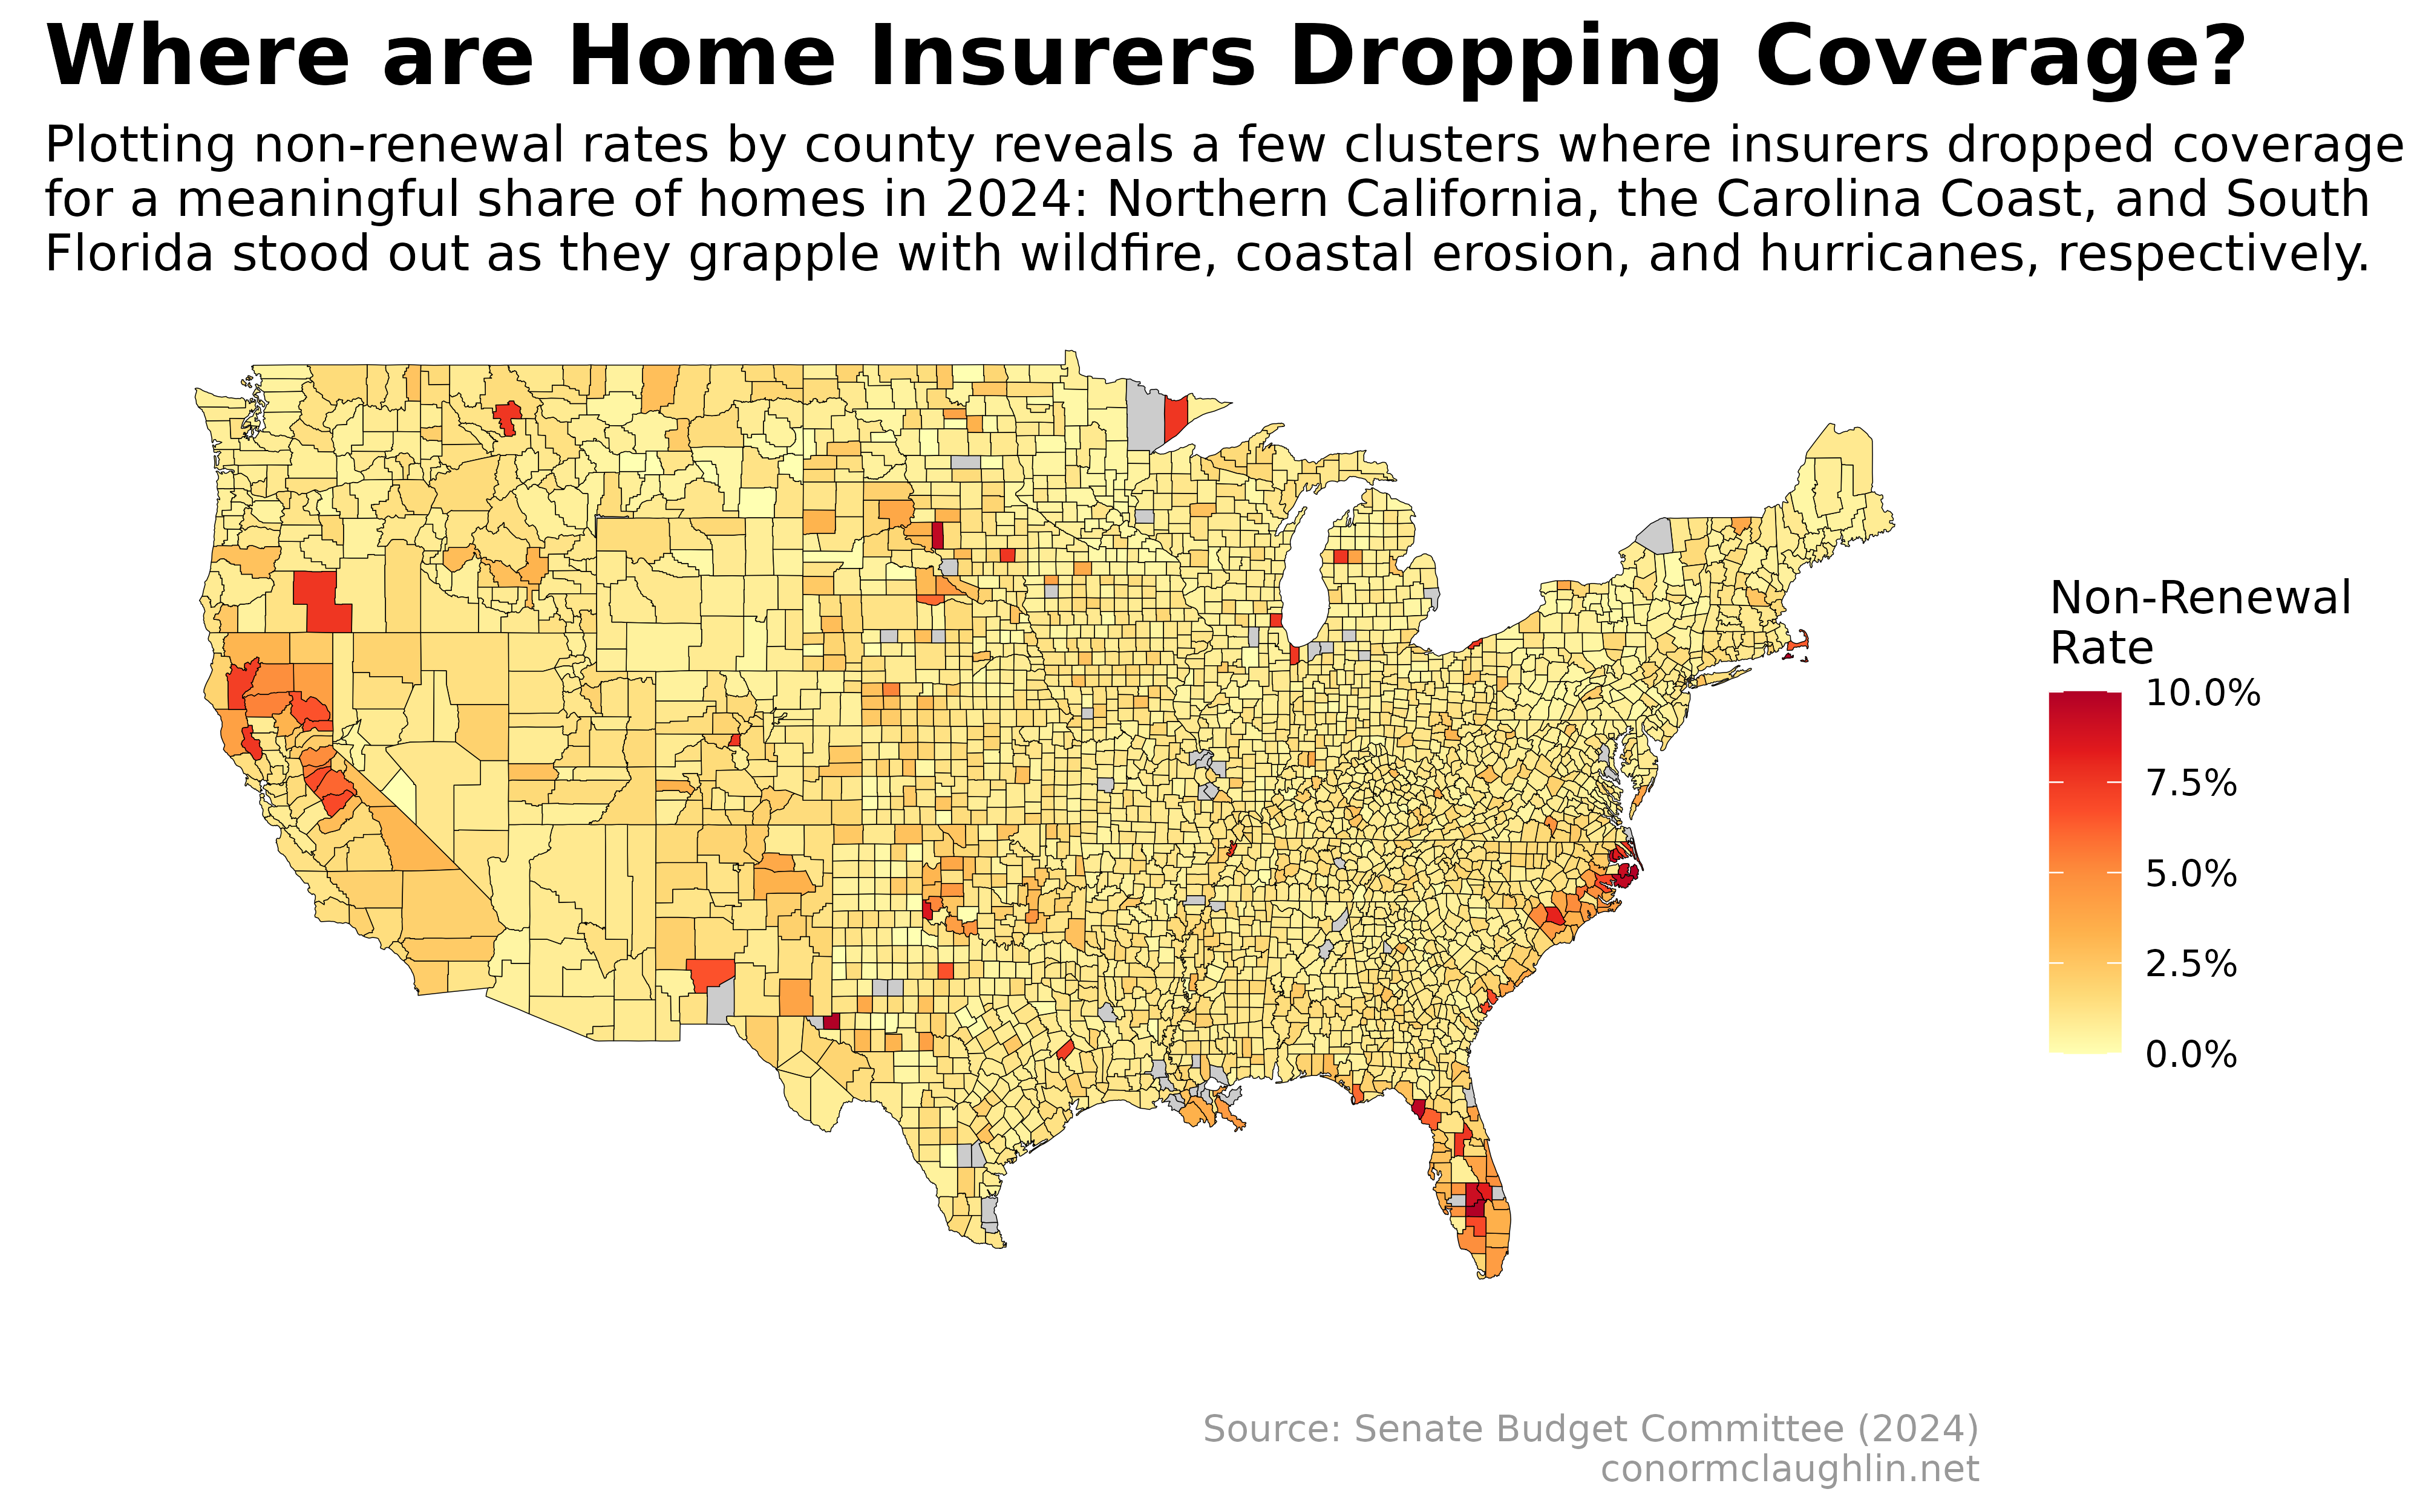
The logic that drove State Farm to end policies in the Palisades has become more prevalent across the whole country - different kinds of climate risks are causing private insurers to back out of areas prone to disasters, leaving families exposed to a lot more risk.
The Senate Budget Committee dataset mentioned earlier has county-by-county data for nearly the entire US, which I used to build a choropleth. At this level, we find that Northern California, South Floria, and the Carolina Coast regions emerge as clear “hot spots” for this trend, with material non-renewal rates at the full-on county level, not just the ZIP level.
The Path Ahead
Moving ahead, it feels like the issues at play will only continue to accelerate: private insurers will find an increasing fraction of our neighborhoods to be un-insurable, and the number of genuine disasters will continue to grow.
I encourage us to be thoughtful about how we can structure an insurance marketplace and housing system which has a dual mandate of:
- ensuring families have a safety net in the event of disaster
- while promoting sustainable development and avoiding excessive subsidization of risky land use patterns
There’s a balance to strike between private and public insurance markets and prescriptive and non-prescriptive housing policies - I hope we can reflect on the fires across LA and make choices that prepare us as well as possible for challenges in the coming decades.
Code Reference
County-Level USA Choropleth
library(readxl)
library(tidyverse)
library(maps)

df <- read_excel("2024_homeowners_insurance_non-renewal_data_senate_budget_committee.xlsx")

df <- df %>% mutate(subregion = tolower(County))

# Get county map data
county_map <- map_data("county")

left_join(x = county_map, y = df, by = "subregion") %>%
  ggplot(aes(long, lat, group = group, fill = `Calculated Non-Renewal Rate`)) +
  geom_polygon(color = "black", size = 0.1) +
  scale_fill_distiller(
    palette = "YlOrRd",
    direction = 1,  # direction = 1 for increasing
    limits = c(0, 0.10),
    oob = scales::squish,
    na.value = "grey80",
    name = "Non-Renewal\nRate",
    labels=scales::percent
    #guide = "none"
  ) +
  coord_fixed(1.3) +
  theme_minimal() +
  theme(
    plot.title = element_text(size = 20, face = "bold"),
    plot.subtitle = element_text(size = 12),
    plot.caption = element_text(colour = "grey60"),
    panel.grid.major = element_blank(),
    panel.grid.minor = element_blank(),
    axis.text = element_blank(),
    plot.title.position = "plot"
  ) +
  labs(x = "",
       y = "",
       title = "Where are Home Insurers Dropping Coverage?",
       subtitle = "Plotting non-renewal rates by county reveals a few clusters where insurers dropped coverage\nfor a meaningful share of homes in 2024: Northern California, the Carolina Coast, and South\nFlorida stood out as they grapple with wildfire, coastal erosion, and hurricanes, respectively.",
       caption = "Source: Senate Budget Committee (2024)\nconormclaughlin.net"
  )
LA Zip Code Choropleth
library(readr)
library(stringr)
library(tidyverse)
library(tigris)
library(sf)
library(RColorBrewer)

# Load CSV of input data
zip_df <- read_csv("non_renewed_state_farm_policies.csv")

# Ensure the rate is a numeric
zip_df$pct_non_renewed <- sapply(str_extract(zip_df$pct_non_renewed, "\\d+"), as.numeric)

# use cache if available
options(tigris_class = "sf", tigris_use_cache = TRUE)

# Load Cali counties
ca_counties <- counties(state = "CA", year = 2000, cb = TRUE)

# Keep only LA and Ventura counties
la_county <- ca_counties %>%
  filter(NAME == "Los Angeles" | NAME == "Ventura" )

# Get ZIPs
zipcodes <- zctas(year = 2000, state = "CA", cb = TRUE)

# Ensure both datasets are in the same CRS
la_county <- st_transform(la_county, st_crs(zipcodes))
zipcodes <- st_transform(zipcodes, st_crs(ca))

# Filter ZIP codes to those within Los Angeles County using spatial intersection
zipcodes_la <- st_intersection(zipcodes, la_county)

# Combine the ZIP code renewal data with the geo df
zipcodes_la <- merge(x = zipcodes_la, y = zip_df, by.x = "ZCTA", by.y = "zip")

# Build Map
ggplot() +
  geom_sf(data = la_county, fill = "gray90", color = "black") +
  geom_sf(data = zipcodes_la, aes(fill = pct_non_renewed / 100), linewidth = 0.1) +
  scale_fill_distiller(
    palette = "YlOrRd",
    direction = 1,
    labels=scales::percent
  ) +
  coord_sf(ylim = c(33.7, max(st_bbox(zipcodes_la)["ymax"]))) +  # Crop below 33.5°N
  theme_minimal() +
  theme(
    plot.title = element_text(size = 20, face = "bold"),
    plot.subtitle = element_text(size = 12),
    plot.caption = element_text(colour = "grey60"),
    panel.grid.major = element_blank(),
    panel.grid.minor = element_blank(),
    axis.text = element_blank(),
    plot.title.position = "plot"
  ) +
  labs(x = "",
       y = "",
       fill = "Non-Renewal\nRate",
       title = "Insurance Non-Renewals Clustered in ZIP Codes\nImpacted by the Palisades Fire",
       subtitle = "Last April, the SF Chronicle highlighted a set of ZIP codes in the LA area where State Farm\nchose not to renew existing home insurance policies at high rates. Unfortunately, the\nareas with the highest percentage of cancelled coverage happen to be exactly where the\nPalisades Fire broke out this January - of particular note is the primary Palisades ZIP,\n90272, where 69% of policies were non-renewed.",
       caption = "Source: SF Chronicle from State Farm\nconormclaughlin.net"
  )