“Elevate to Celebrate”, an all-time great sports catchphrase, entered the baseball lexicon sometime in 2016 or 2017, giving shape to a trend that had been underway but nameless.
During those years, players like Jose Altuve, Jose Bautista, and Daniel Murphy underwent well-publicized and shockingly successful swing transformations which led them to career best seasons.
The key? Banishing the advice of Little League coaches around the country, imploring batters to “square the ball up”. Instead, these batters focused on pulling their swing path up slightly, imparting an upwards trajectory on the ball.
That increase in launch angle was quickly shown to boost offensive production, with batters hitting fewer ground balls and a lot more home runs - something that spread like wildfire across MLB, and led to “Elevate to Celebrate” becoming a near-household term.
Why This Article Now?
I was recently digging through some MLB team hitting data, and was blown away by how much the 2025 Washington Nationals are ignoring these lessons from the past - they lead the league in ground ball rate by a mile and rank 26th of 30 in Home Runs hit, a figure that has regressed a ton after a strong start to the season.
With that context, I thought the coaching staff, especially Hitting Coach Darnell Coles, could use a reminder that the approach they are currently espousing is antiquated and potentially toxic to the development of our talented-but-unproven young hitters… Please - PLEASE - stop encouraging our players to hit the ball on the ground!
Visualizations
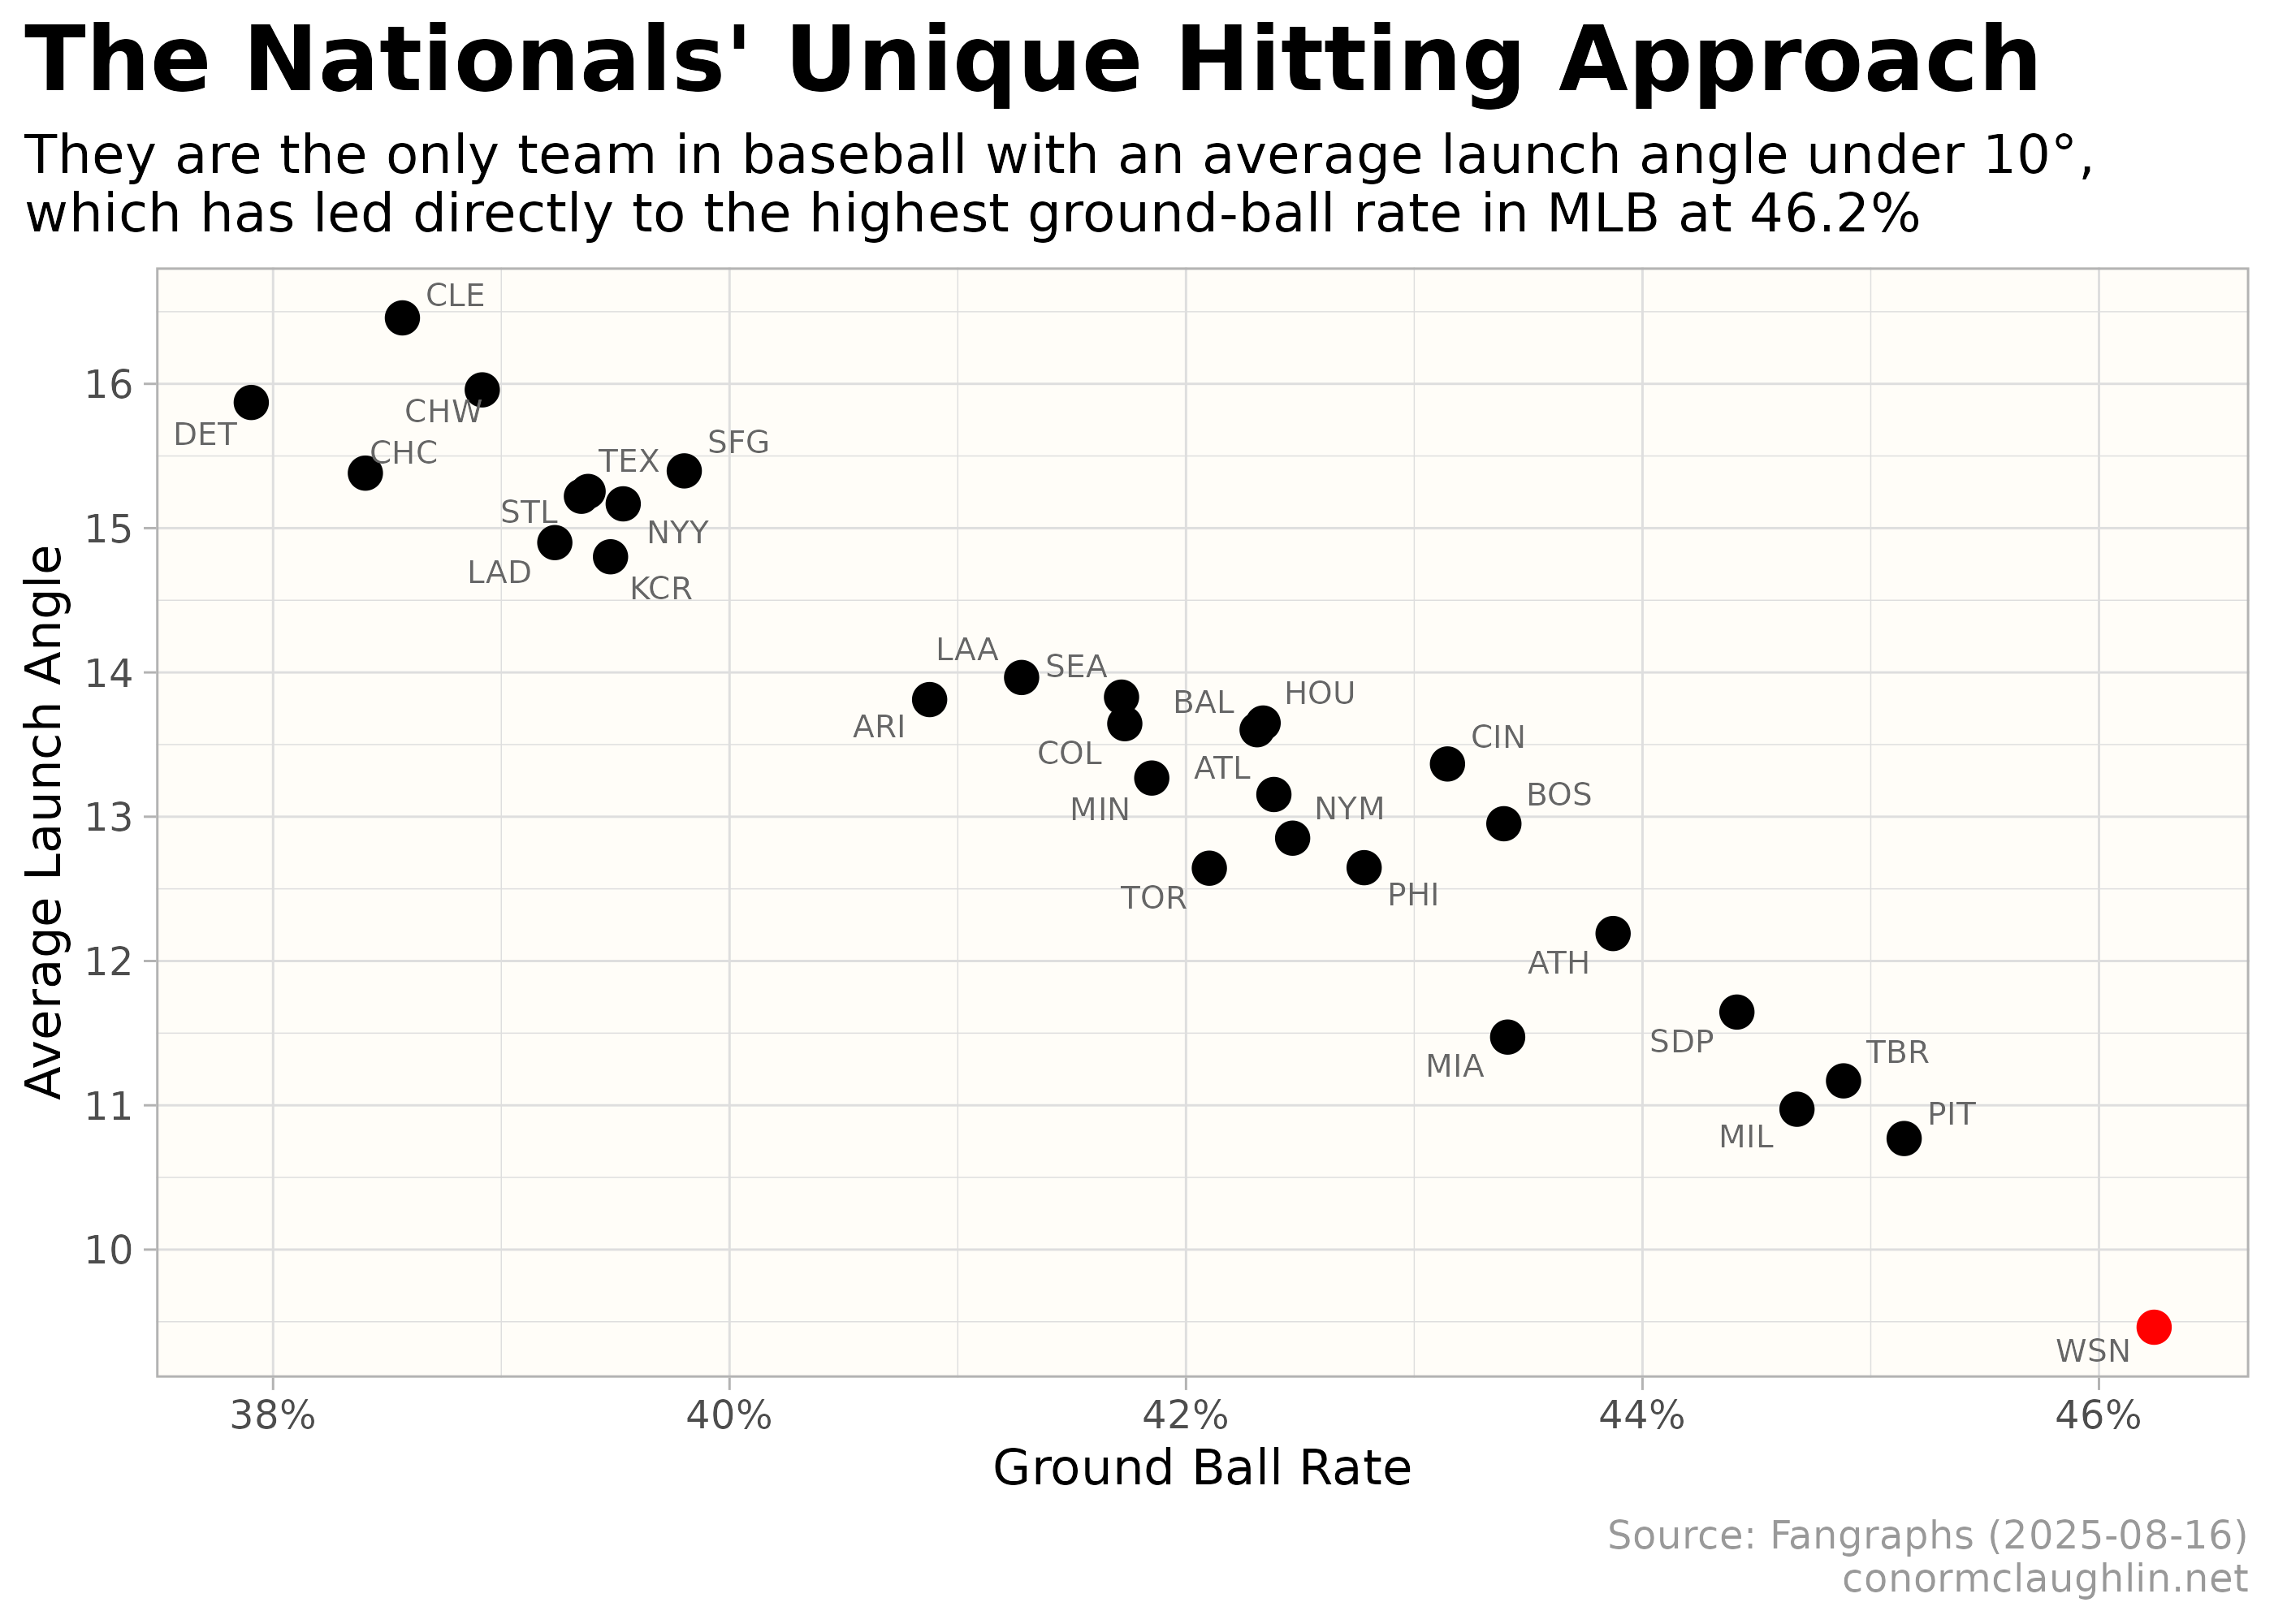
Ground Ball Rate and Launch Angle
The evidence shows the Nats are a clear anomaly - hitting over 46% of their batted balls on the ground, as a direct function of the <10 degree launch angle they swing with, on average.
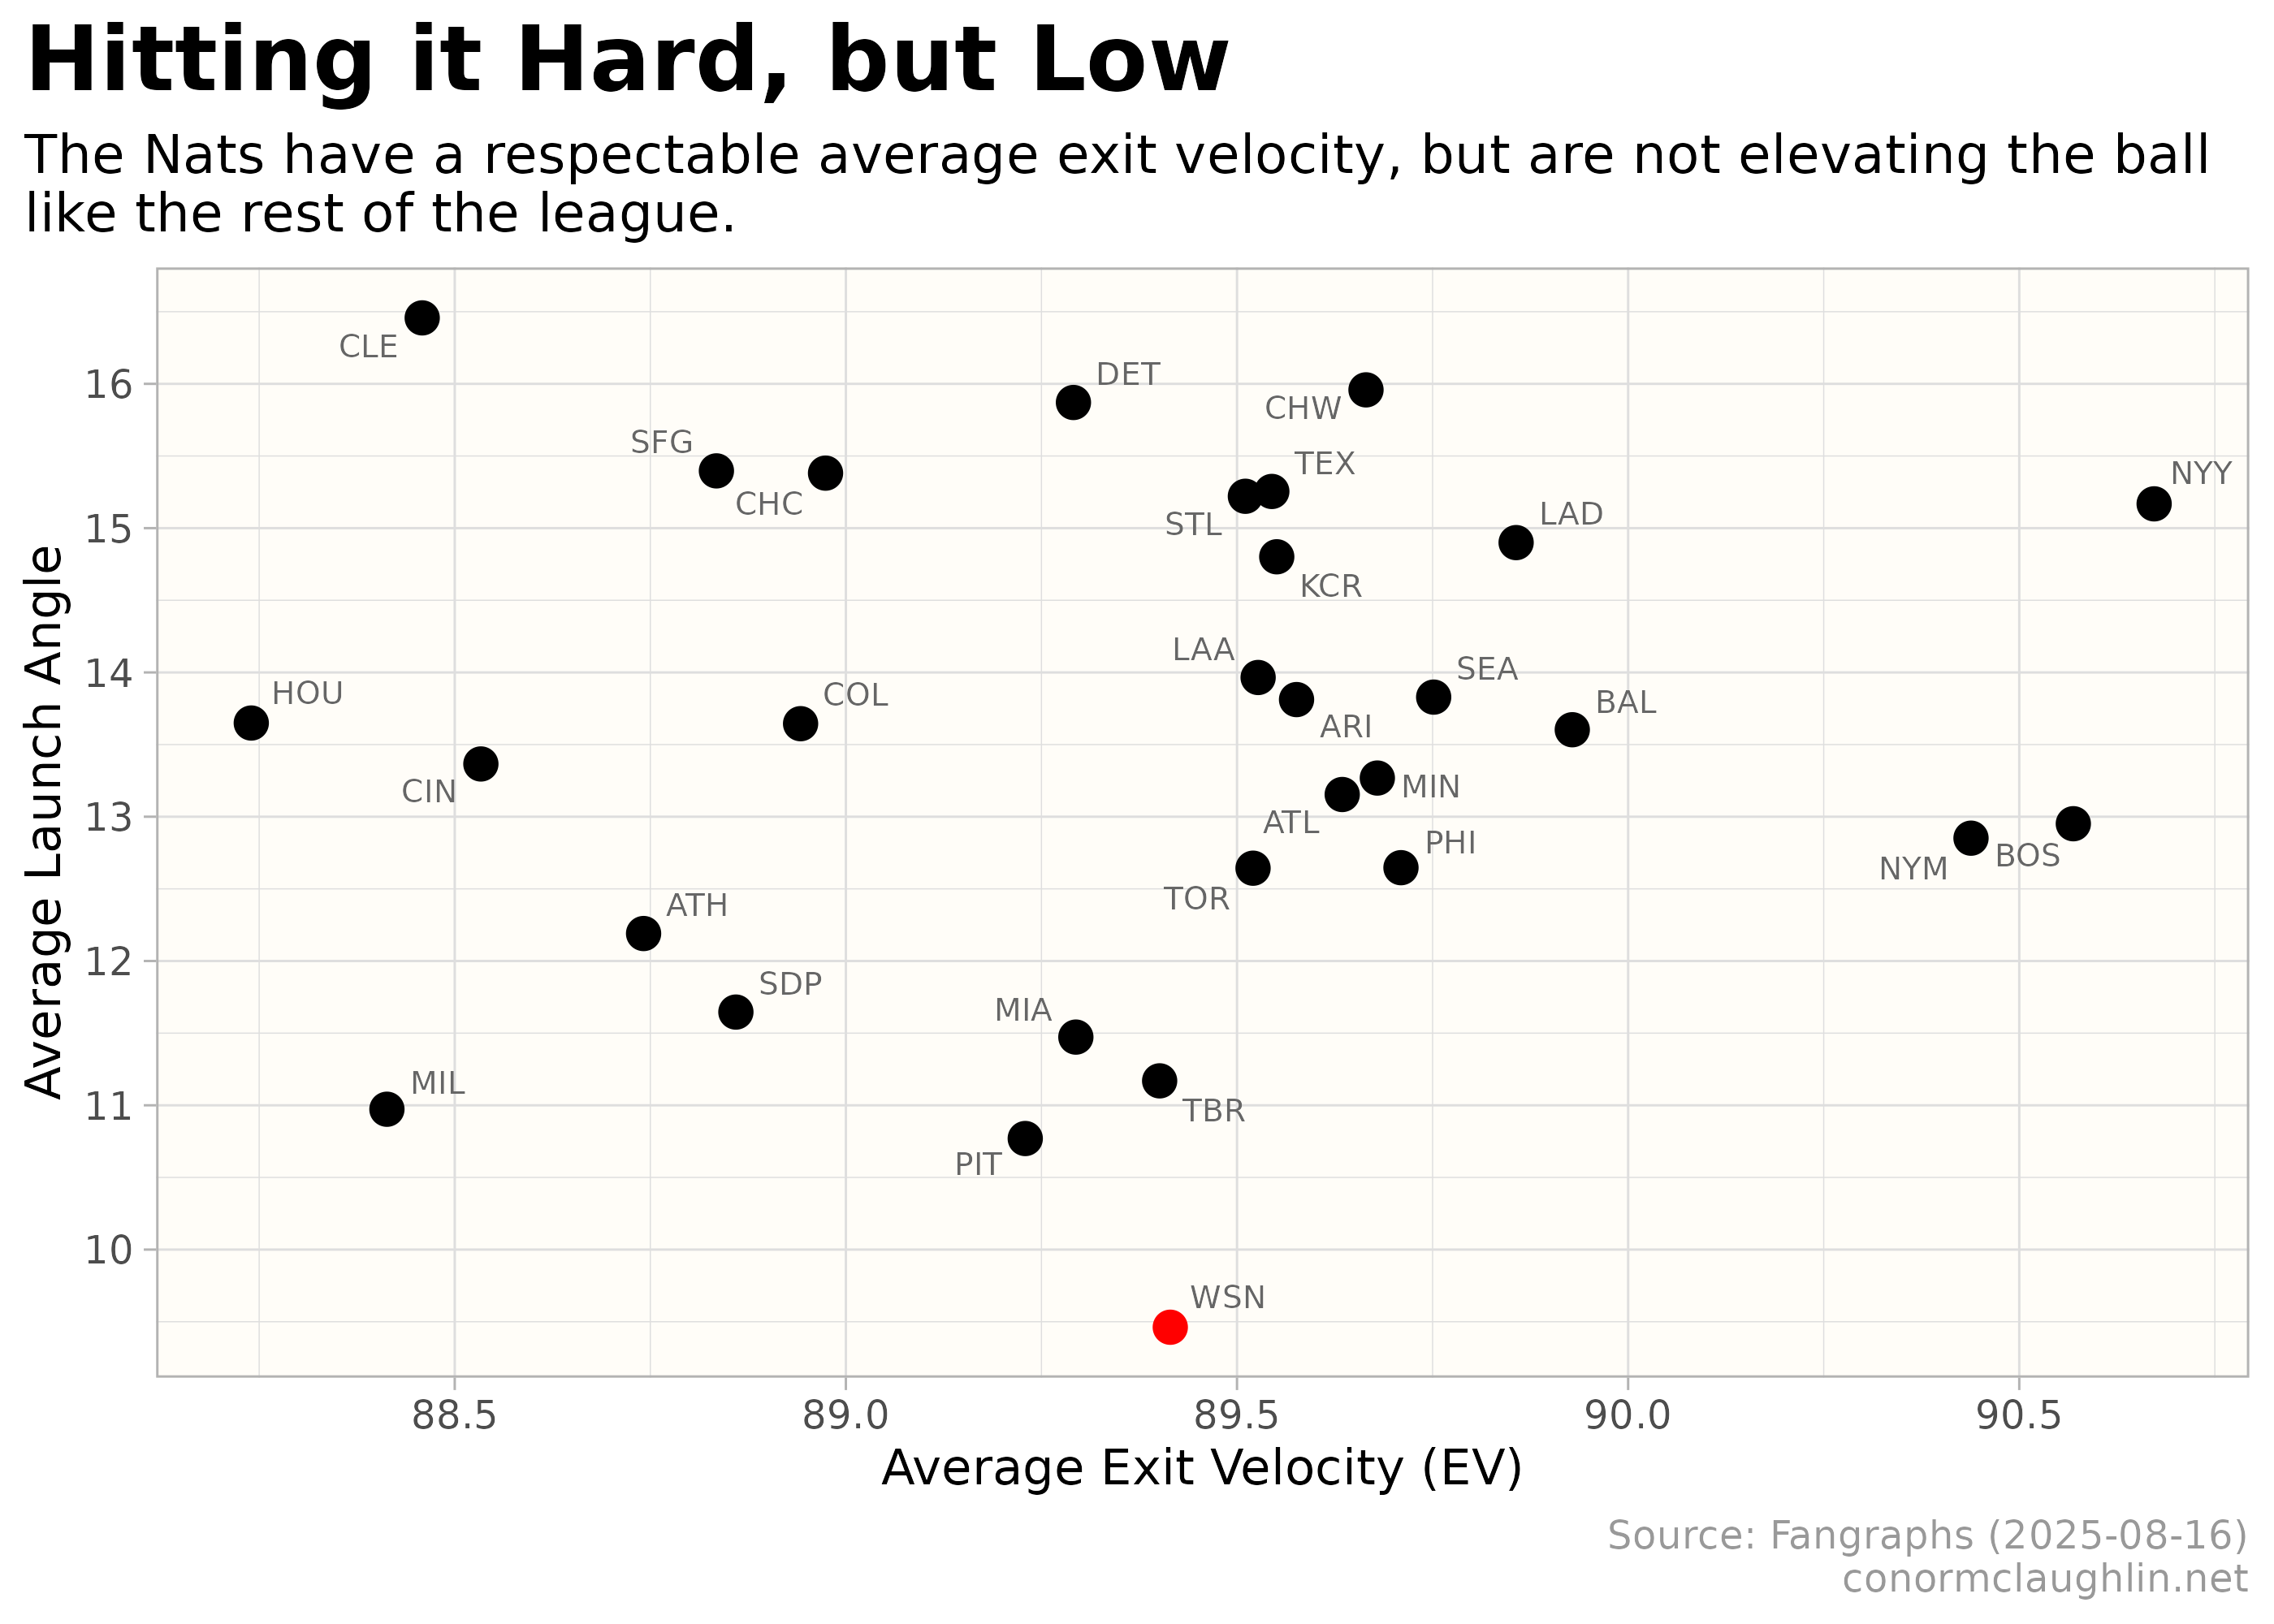
Launch Angle and Ground Ball Rate
The Nats hit the ball just as hard, and sometimes harder, than some very serious offenses - the Detroit Tigers and Toronto Blue Jays being clear parallels in terms of average exit velocity, but who have had much better offensive seasons largely by being better at hitting the ball hard and in the air.
| Team | Avg. Exit Velocity (mph) | Avg. Launch Angle | OPS |
|---|---|---|---|
| TOR | 89.5 | 12.6 | .768 |
| DET | 89.3 | 15.8 | .736 |
| WSN | 89.4 | 9.5 | .697 |
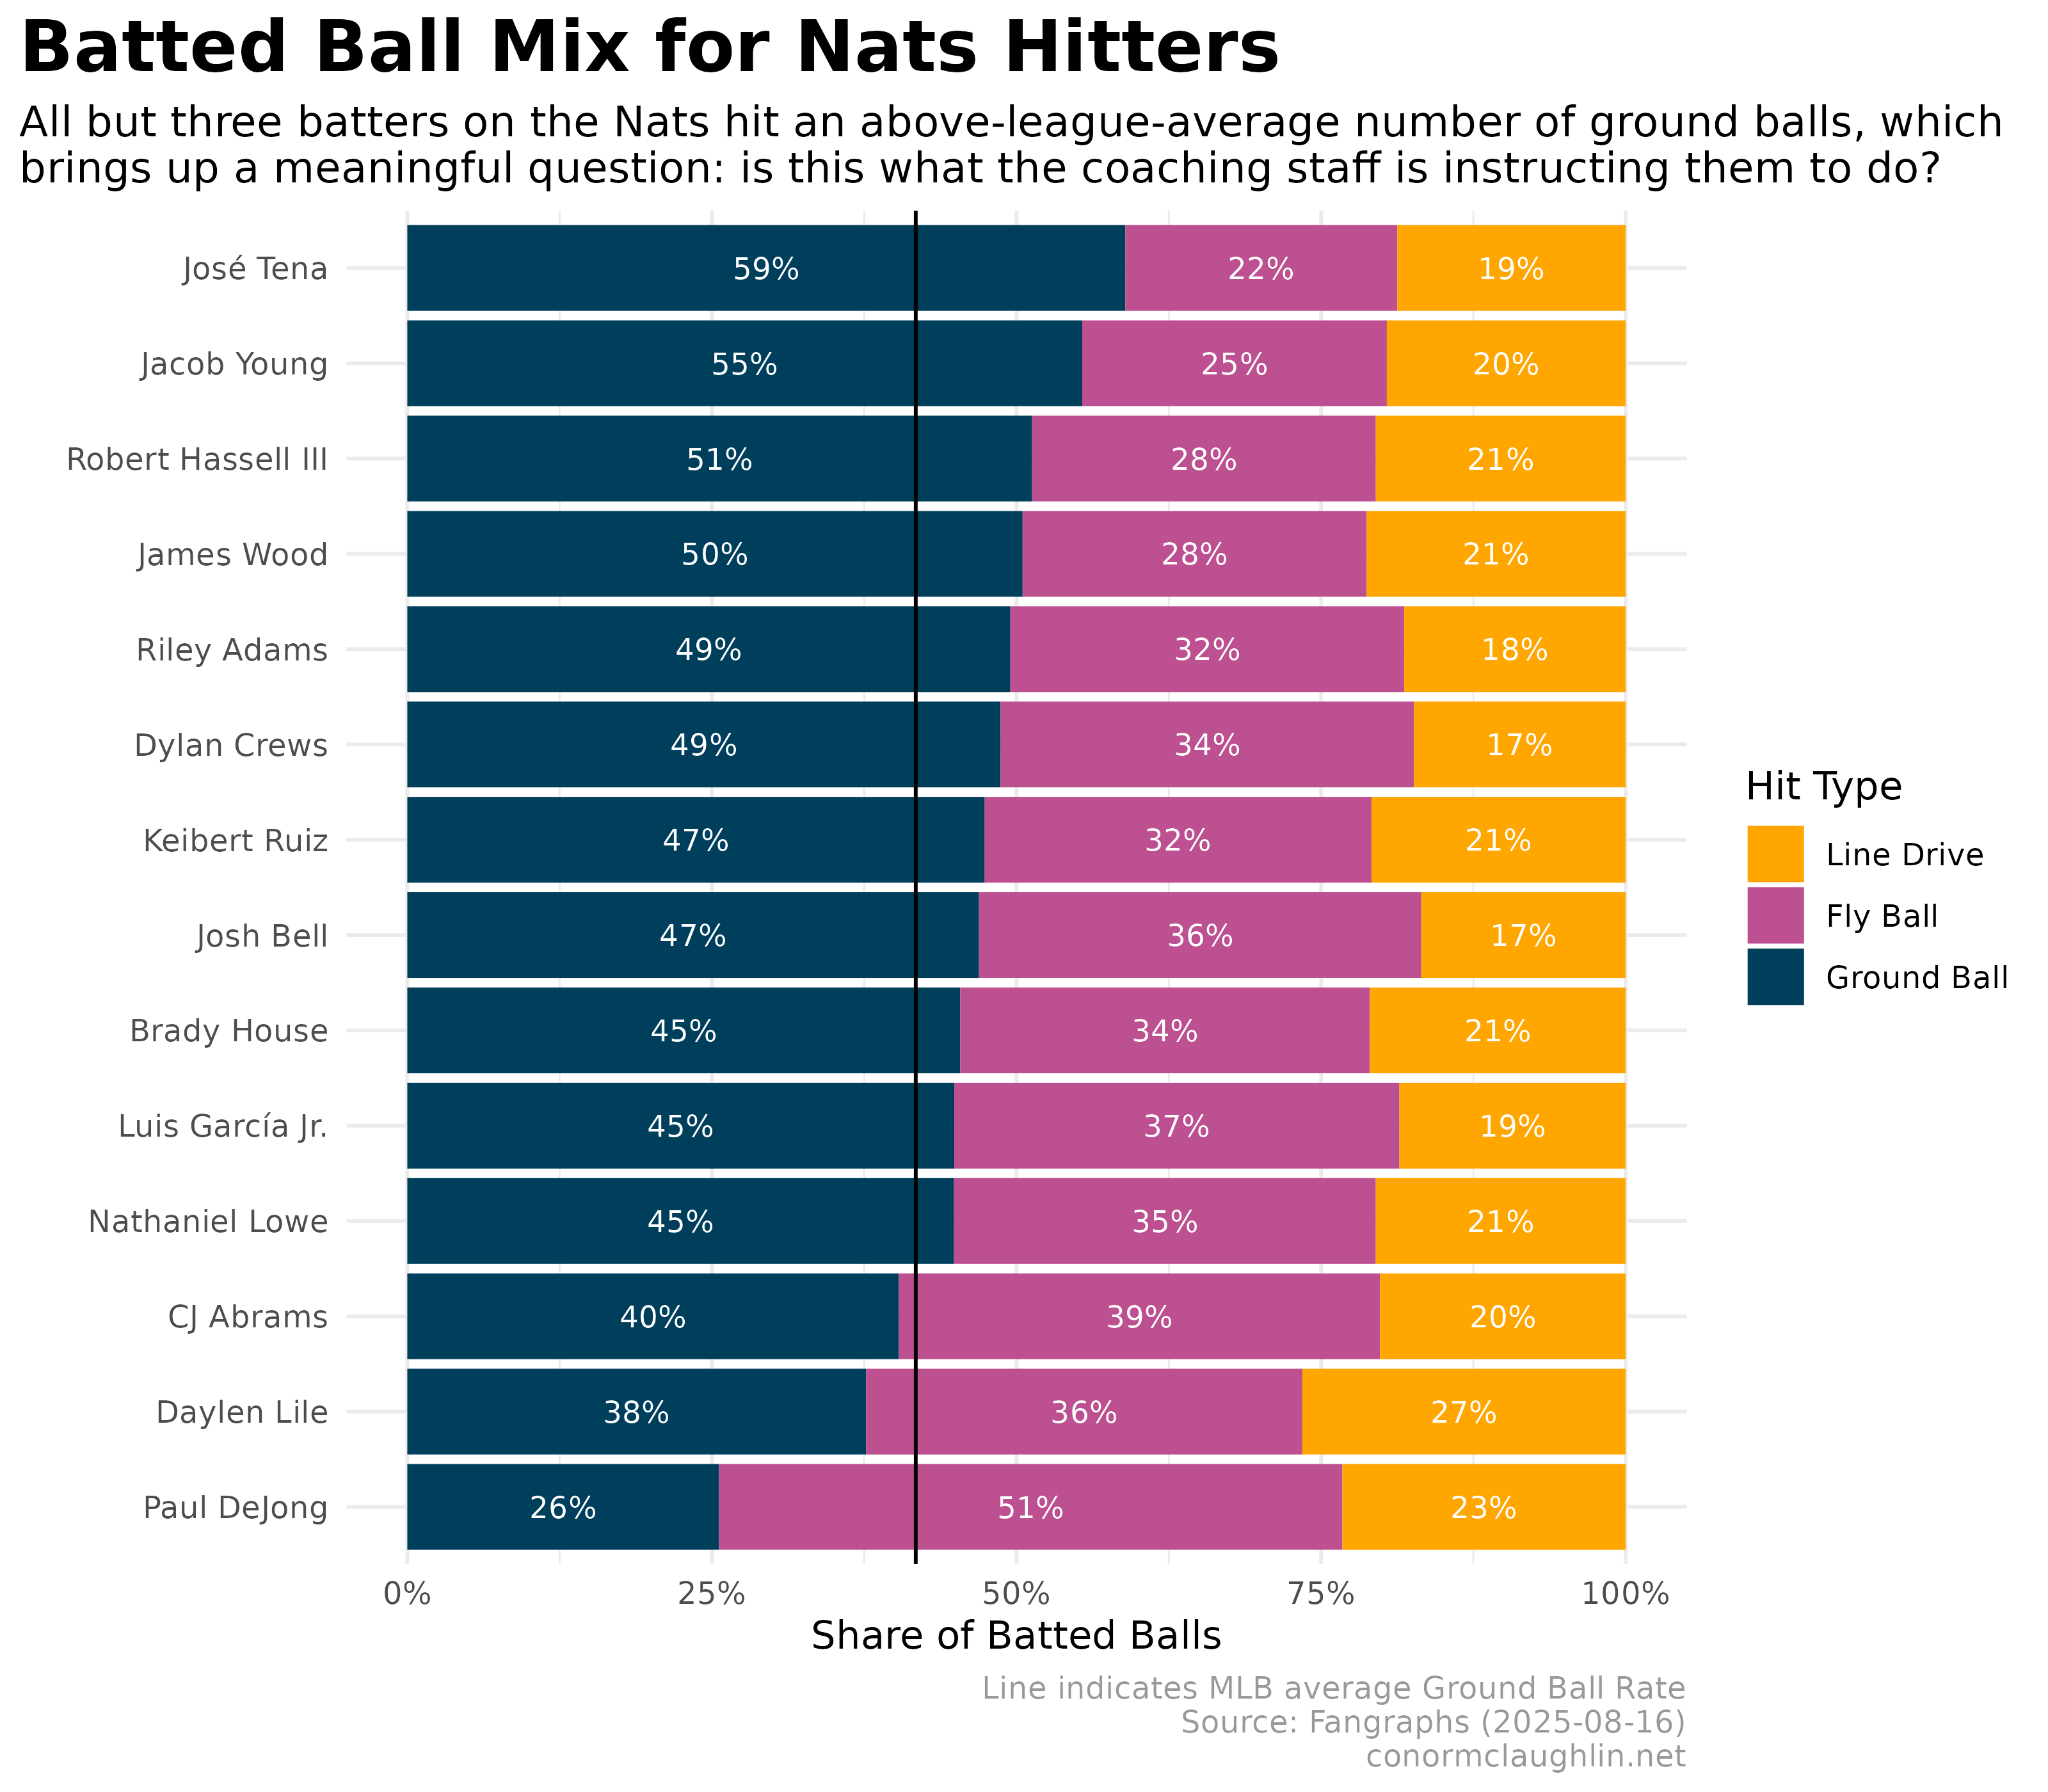
Batted Ball Mix, 2025 Nationals Hitters
Troublingly, except for a few hitters (bless you, CJ Abrams, Daylen Lile, and Paul DeJong), it seems that most of the Nationals’ lineup has been infected with the ground ball disease!
To me, this is the biggest indicator that a systematic coaching approach is to blame - all else equal, I’d expect a team to have more heterogeneity in results on a player-to-player basis - and the lack thereof makes me think that the organization is pushing hitters to have a ground-ball heavy approach.
New GM Mike DeBartolo - fix this!
Code Reference
This data was quite easy to collect using the excellent baseballr package, which makes exit velocity, launch angle, and batted ball type data easily obtainable.
Obtain Latest Ground Ball Data using baseballr
library(baseballr)
library(tidyverse)

# Fetch team batting data from FanGraphs for the 2025 season
team_batting <- fg_team_batter(startseason = 2025, endseason = 2025)

# Calculate the Ground Ball Rate (GB%)
team_batting <- team_batting %>%
  mutate(ground_ball_rate = GB / (GB + FB + LD))
Scatterplot of Ground Ball Rate and Launch Angle
library(ggrepel)

team_batting %>%
  ggplot(aes(x = LA, y = ground_ball_rate, label = team_name)) +
    geom_point(aes(color = team_name == "WSN"), size = 3) +
    scale_color_manual(values = c("FALSE" = "black", "TRUE" = "red"), guide = "none") +
    scale_x_continuous(breaks = scales::pretty_breaks(n = 6)) +
    scale_y_continuous(labels = scales::percent_format(), breaks = scales::pretty_breaks(n = 6)) +
    coord_flip() +
    geom_text_repel(color = "grey40", size = 2.5) +
    theme_light() +
    theme(
      strip.background = element_rect(fill = "grey30"),
      strip.text = element_text(color = "grey97", face = "bold"),
      legend.background = element_rect(color = NA),
      plot.title = element_text(size = 20, face = "bold"),
      plot.subtitle = element_text(size = 12),
      plot.caption = element_text(colour = "grey60"),
      plot.title.position = "plot",
      panel.background = element_rect(fill = "#FFFDF8", color = NA)
    ) +
    labs(
      x = "Average Launch Angle",
      y = "Ground Ball Rate",
      title = "The Nationals' Unique Hitting Approach",
      subtitle = "They are the only team in baseball with an average launch angle under 10°,\nwhich has led directly to the highest ground-ball rate in MLB at 46.2%",
      caption = "Source: Fangraphs (2025-08-16)\nconormclaughlin.net"
    )
Batted Ball Mix for Individual Hitters
Retrieve Player Level Batting Data using baseballr
player_batting <- fg_batter_leaders(startseason = 2025, endseason = 2025) %>%
  filter(team_name == "WSN") %>%
  filter(AB >= 100) %>%
  mutate(
    ground_ball_rate = GB / (GB + FB + LD),
    fly_ball_rate = FB / (GB + FB + LD),
    line_drive_rate = LD / (GB + FB + LD)
  )
Process the Player Dataframe
library(reshape2)
library(scales)

# Melt the data
melted_data <- player_batting %>%
  select("PlayerName", "ground_ball_rate", "fly_ball_rate", "line_drive_rate", "EV", "LA") %>%
  melt() %>%
  filter(variable %in% c("ground_ball_rate", "line_drive_rate", "fly_ball_rate"))

# Player ordering
melted_data$PlayerName <- reorder(melted_data$PlayerName,
                                  player_batting$ground_ball_rate[match(melted_data$PlayerName, player_batting$PlayerName)],
                                  FUN = function(x) -mean(x))

# Factor ordering
melted_data$variable <- factor(melted_data$variable, levels = rev(levels(melted_data$variable)))

player_order <- player_batting %>%
  arrange(desc(ground_ball_rate)) %>%
  pull(PlayerName)

melted_data$PlayerName <- factor(melted_data$PlayerName, levels = rev(player_order))
Build the 100% Bar Chart
ggplot(melted_data, aes(x = PlayerName, y = value, fill = variable)) +
  geom_col() +
  scale_y_continuous(labels = percent_format(accuracy = 1)) +
  geom_text(aes(label = scales::percent(value, accuracy = 1)),
            position = position_stack(vjust = 0.5),
            size = 3, color = "white") +
  geom_hline(aes(yintercept =
    team_batting %>%
      summarize(ground_ball_rate = sum(GB) / (sum(GB) + sum(FB) + sum(LD))) %>%
      pull()
  )) +
  coord_flip() +  # To make it horizontal
  scale_fill_manual(
    name = "Hit Type",
    values = c(
      "ground_ball_rate" = "#003f5c",
      "line_drive_rate" = "#ffa600",
      "fly_ball_rate" = "#bc5090"
    ),
    labels = c(
      "ground_ball_rate" = "Ground Ball",
      "line_drive_rate" = "Line Drive",
      "fly_ball_rate" = "Fly Ball"
    )
  ) +
  theme_minimal() +
  theme(
    strip.background = element_rect(fill = "grey30"),
    strip.text = element_text(color = "grey97", face = "bold"),
    legend.background = element_rect(color = NA),
    plot.title = element_text(size = 20, face = "bold"),
    plot.subtitle = element_text(size = 12),
    plot.caption = element_text(colour = "grey60"),
    plot.title.position = "plot"
  ) +
  labs(
    y = "Share of Batted Balls",
    x = "",
    title = "Batted Ball Mix for Nats Hitters",
    subtitle = "All but three batters on the Nats hit an above-league-average number of ground balls, which\nbrings up a meaningful question: is this what the coaching staff is instructing them to do?",
    caption = "Source: Fangraphs (2025-08-16)\nconormclaughlin.net"
  )