One of the most unstoppable trends in baseball has been the steady increase in fastball velocity, with relievers and now starters throwing meaningfully harder than they did ten, or even five, years ago.
A Minneapolis Twins fan site (humorously named Twinkie Town) put together some great graphics of this trend - so good that I’ll just re-post them below to illustrate the trend.
One thing to call out is that the trend has continued more or less linearly since 2022 (the latest year in the graphic) - the average fastball velocity for all pitchers in the 2025 season was 94.5 mph.

Visualizing Home Run Rate
One thing I’ve been curious about, but not seen any hard data on, is the relationship between fastball velocity and the frequency of home runs hit. On one hand, faster pitches do provide some extra exit velocity when struck by the hitters. On the other hand, harder fastballs are quite a bit more difficult to hit in the first place, and harder to barrel up even contact is made.
Since data quantifying this relationship wasn’t easily findable, I decided it was a great topic for a blog post!
What we See
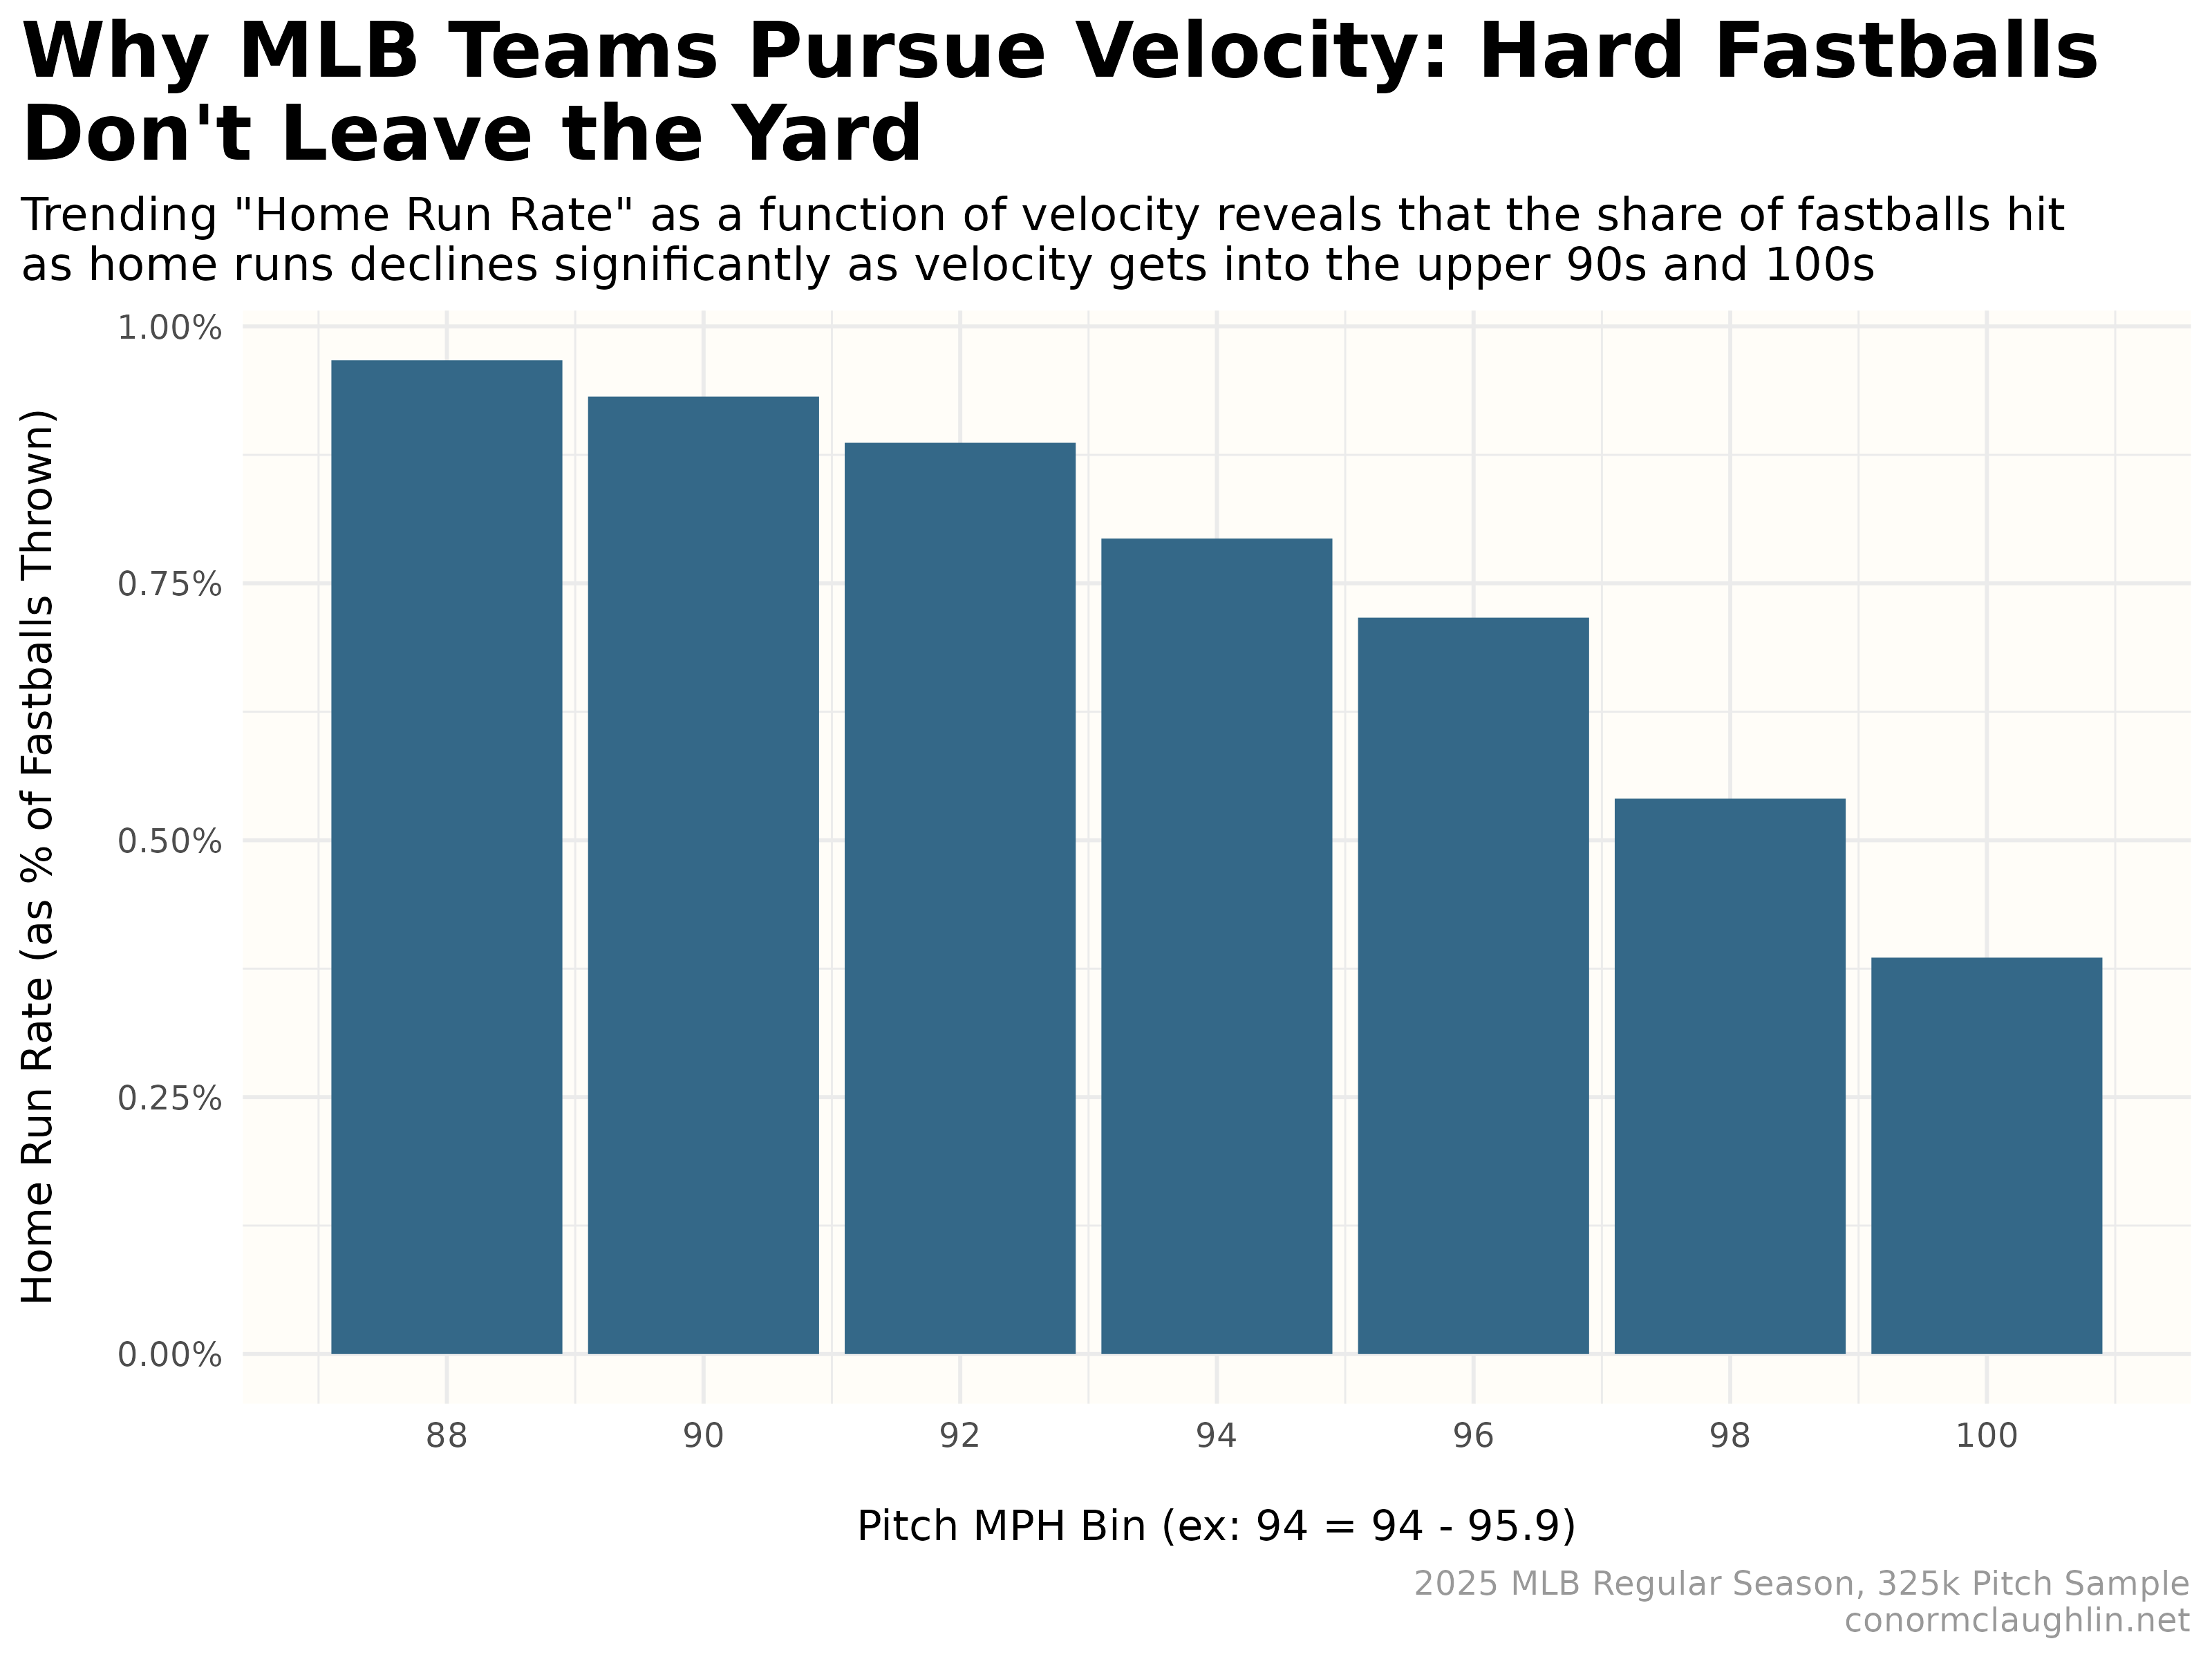
Sampling about 325k fastballs thrown in the 2025 season, binning them in increments of 2 mph, and quantifying the rate at which those pitches turned into home runs shows that there are clear and sustained benefits from throwing harder.
Pitchers are notably more effective in suppressing home runs when throwing 98+ rather than 96-97 mph - showing why there has been such a push across MLB to use hard-throwing relievers and increase starter velocities, even when that comes with injury and workload tradeoffs.
Code Reference
Function to Fetch Pitches from MLB Statcast using baseballr
library(baseballr)
library(tidyverse)
library(stringr)

get_fastballs <- function(start_date, end_date) {
  fastball_codes <- c("FF", "FT", "SI", "FC", "FA")  # 4-seam, 2-seam, sinker, cutter, generic

  statcast_search(
    start_date = start_date,
    end_date   = end_date
  ) %>%
    filter(
      pitch_type %in% fastball_codes
    ) %>%
    transmute(
      game_date,
      pitch_velocity_mph = release_speed,
      swing_outcome = case_when(
        str_detect(description, "swinging_strike|swinging_strike_blocked") ~ "miss",
        str_detect(description, "foul_tip|foul$|foul_bunt")                ~ "foul",
        str_detect(description, "hit_into_play")                            ~ "in_play",
        TRUE ~ NA_character_
      ),
      batted_ball_result = case_when(
        str_detect(description, "hit_into_play") ~ events,
        TRUE ~ NA_character_
      )
    )
}
Function to Iterate over Weeks of the Season
# Helper to iterate across the season in <=7 day chunks
get_fastballs_season <- function(season_start = "2025-03-20",
                                       season_end   = "2025-10-01",
                                       chunk_days   = 7,
                                       pause_sec    = 0.4) {

  starts <- seq(as.Date(season_start), as.Date(season_end), by = chunk_days)
  ends   <- pmin(starts + (chunk_days - 1), as.Date(season_end))

  safe_call <- purrr::possibly(
    function(s, e) {
      get_fastballs(as.character(s), as.character(e))
    },
    otherwise = tibble()
  )

  map2_dfr(starts, ends, function(s, e) {
    out <- safe_call(s, e)
    Sys.sleep(pause_sec)  # be polite to the API
    out
  })
}
Building the Chart
fb_df <- get_fastballs_season()

fb_df %>%
  group_by(pitch_velocity_bin, batted_ball_result) %>%
  summarize(
    count = n()
  ) %>%
  ungroup() %>%
  group_by(pitch_velocity_bin) %>%
  mutate(
    pct = count / sum(count)
  ) %>%
  filter(pitch_velocity_bin >= 88) %>%
  filter(batted_ball_result == "home_run") %>%
  ggplot(aes(x = pitch_velocity_bin, y = pct)) +
    geom_col(fill = "#346888") +
    scale_x_continuous(breaks = seq(86, 102, 2)) +
    scale_y_continuous(labels = scales::percent_format()) +
    theme_minimal() +
    theme(
      strip.background = element_rect(fill = "grey30"),
      strip.text = element_text(color = "grey97", face = "bold"),
      legend.background = element_rect(color = NA),
      plot.title = element_text(size = 20, face = "bold"),
      plot.subtitle = element_text(size = 12),
      plot.caption = element_text(colour = "grey60"),
      plot.title.position = "plot",
      panel.background = element_rect(fill = "#FFFDF8", color = NA)
    ) +
    labs(
      x = "\nPitch MPH Bin (ex: 94 = 94 - 95.9)",
      y = "Home Run Rate (as % of Fastballs Thrown)\n",
      title = "Why MLB Teams Pursue Velocity: Hard Fastballs\nDon't Leave the Yard",
      subtitle = "Trending \"Home Run Rate\" as a function of velocity reveals that the share of fastballs hit\nas home runs declines significantly as velocity gets into the upper 90s and 100s",
      caption = "conormclaughlin.net"
    )