Last Sunday, the U.S. Attorney’s Office for the Eastern District of New York unsealed an indictment against two Cleveland Guardians pitchers, Emmanuel Clase and Luis Ortiz, for rigging pitches.
In the scheme, Clase and Ortiz would intentionally throw pitches, usually for balls, often below certain speed levels, so that “prop bets” on those individual pitches would pay off for their co-conspirators, who would then kick back a slice of the winnings.
We first became aware of something going on when the two players were originally suspended in June, but I wanted to look a little deeper into the story now because it is just that crazy! And the specifics within the indictment are very helpful for confirming what was going on.
The Original Thinking in June
When the news originally broke in June, some smart folks on Reddit quickly shared compilation videos of Clase spiking fastballs and sliders into the dirt on the first pitches of the inning during his outings.
As a former pitcher, throwing off on that particular pitch makes intuitive sense:
- going down 1-0 in the count is not that big a deal - an intentional ball here doesn’t necessarily torpedo the at-bat or the outing
- it’s pretty deniable - you can play off the poor pitch as a “getting warm” type of one-off mistake
- no runners are on base, so passed balls aren’t an issue
- throwing an intentional ball later in the outing would be:
- harder to communicate to one’s co-conspirators to bet on
- potentially more costly in terms of actual game outcomes
Compilation of first pitch balls by Emmanuel Clase that are ‘believed’ to be in question during his sports betting investigation.
byu/LightskinKnowItAll inmlb
Specific Pitches from Indictment
The indictment shared by the DOJ has more detail on the specific pitches which were rigged as part of the conspiracy, with text message and betting data used to validate them: the pattern definitely matches what we thought back in June - mostly sliders thrown as intentional balls.
Interestingly, the DOJ found evidence that Clase had started doing this all the way back in 2023, before ramping up his activity in April and May of 2025 and pulling in Luis Ortiz in June.
Just on these pitches, bettors seem to have won around $240k in prop bets! A serious haul, but also probably the reason for their demise… betting so much on such small, specific prop bets, was likely to draw attention from the sports books.
From a risk-reward standpoint, I find it inconceivable that Clase in particular, a three-time All Star, would risk so much for so little: Spotrac indicates his 2026 compensation would have been $6.4M, with club options for 2027 and 2028 for another $10M a year!
Emmanuel Clase
| Date | Opponent | Alleged Intentional Pitch Details | Outcome & Betting Activity |
|---|---|---|---|
| May 19, 2023 | New York Mets | Agreed in advance to throw a pitch faster than 94.95 mph. | Bettors won ≈ $27,000 on Betting Platform-2. |
| June 3, 2023 | Minnesota Twins | Threw slower than 94.95 mph and into the dirt (Ball/HBP). | Bettors won ≈ $38,000. |
| June 7, 2023 | Boston Red Sox | Threw slower than 94.95 mph and low into the dirt (Ball/HBP). | Bettors won ≈ $58,000. |
| April 12, 2025 | Opponent not specified | Threw into the grass, slower than 98.45 mph (Ball/HBP). | Bettors won ≈ $15,000; followed by bribe payments. |
| April 26, 2025 | Boston Red Sox | Threw slower than 97.95 mph after coordinating via phone mid-game. | Bettors won ≈ $11,000. |
| May 11, 2025 | Opponent not specified | Threw a low first pitch that was a ball (Ball/HBP). | Bettors won ≈ $11,000. |
| May 13, 2025 | Opponent not specified | Threw slower than 99.45 mph, low and in the dirt (Ball/HBP). | Bettors won ≈ $3,500. |
| May 17, 2025 | Cincinnati Reds | Threw slower than 97.95 mph and low into the dirt (Ball/HBP). | Bettors won ≈ $10,000. |
| May 28, 2025 | Los Angeles Dodgers | Threw outside the zone on a ball/bet, but batter swung (strike). | Bettors lost ≈ $4,000. |
Luis Ortiz
| Date | Opponent | Alleged Intentional Pitch Details | Outcome & Betting Activity |
|---|---|---|---|
| June 15, 2025 | Seattle Mariners | First pitch of 2nd inning — intentionally threw a ball low and left (“Subject Pitch-1”). | Bettors won ≈ $26,000; Ortiz & Clase received ≈ $10,000 in bribes. |
| June 27, 2025 | St. Louis Cardinals | First pitch of 3rd inning — threw a ball into the ground far from strike zone (“Subject Pitch-2”). | Bettors won ≈ $37,000; Ortiz & Clase split ≈ $14,000 in bribes. |
Visualizations
I wanted to write this post partly to dunk on Clase and Ortiz for being idiots, and partly because I thought it would be a fun exercise to “prove out” that the pitches being rigged looked materially different!
So don’t expect anything too crazy, but feel free to read on if you want to see a few charts that illustrate what these guys were up to.
Pitch Location
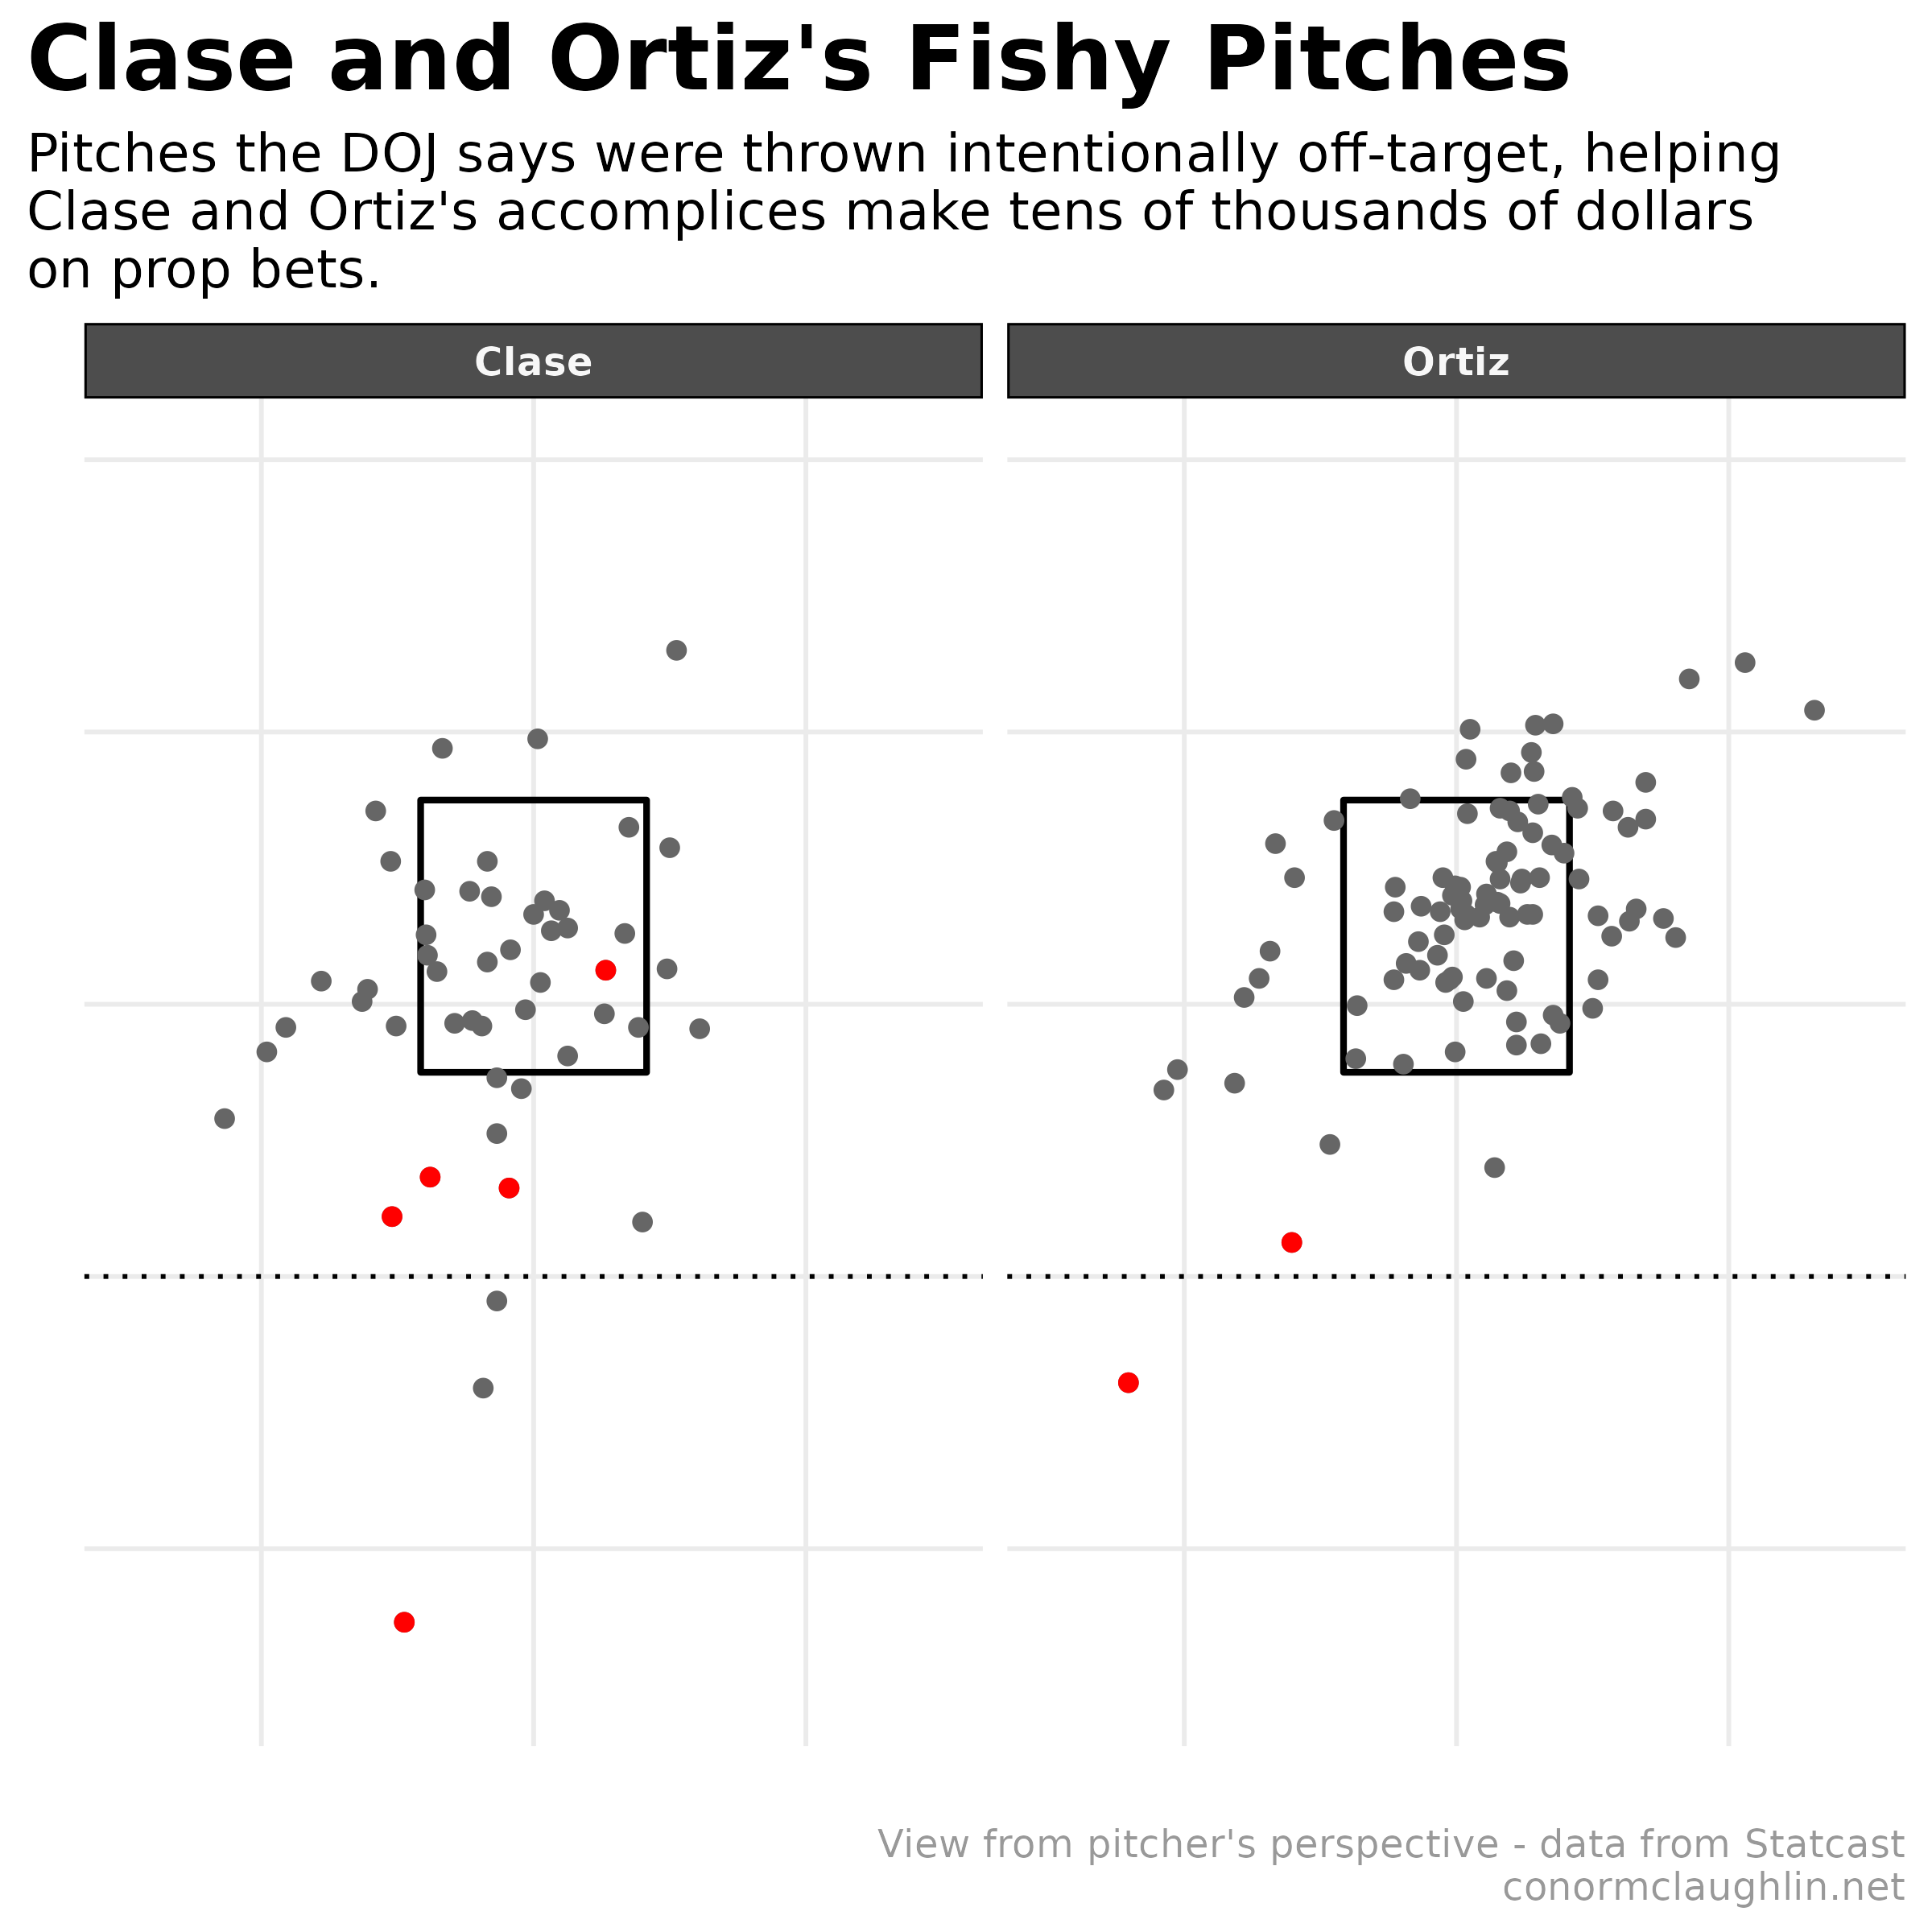
Plotting the locations of first pitches thrown by Clase and Ortiz in 2025 seemed like a good first stop… mixing in the known bad pitches from the indictment, it immediately becomes clear that the rigged pitches were thrown down in the dirt, away from the strikezone.
Local Outlier Recognition
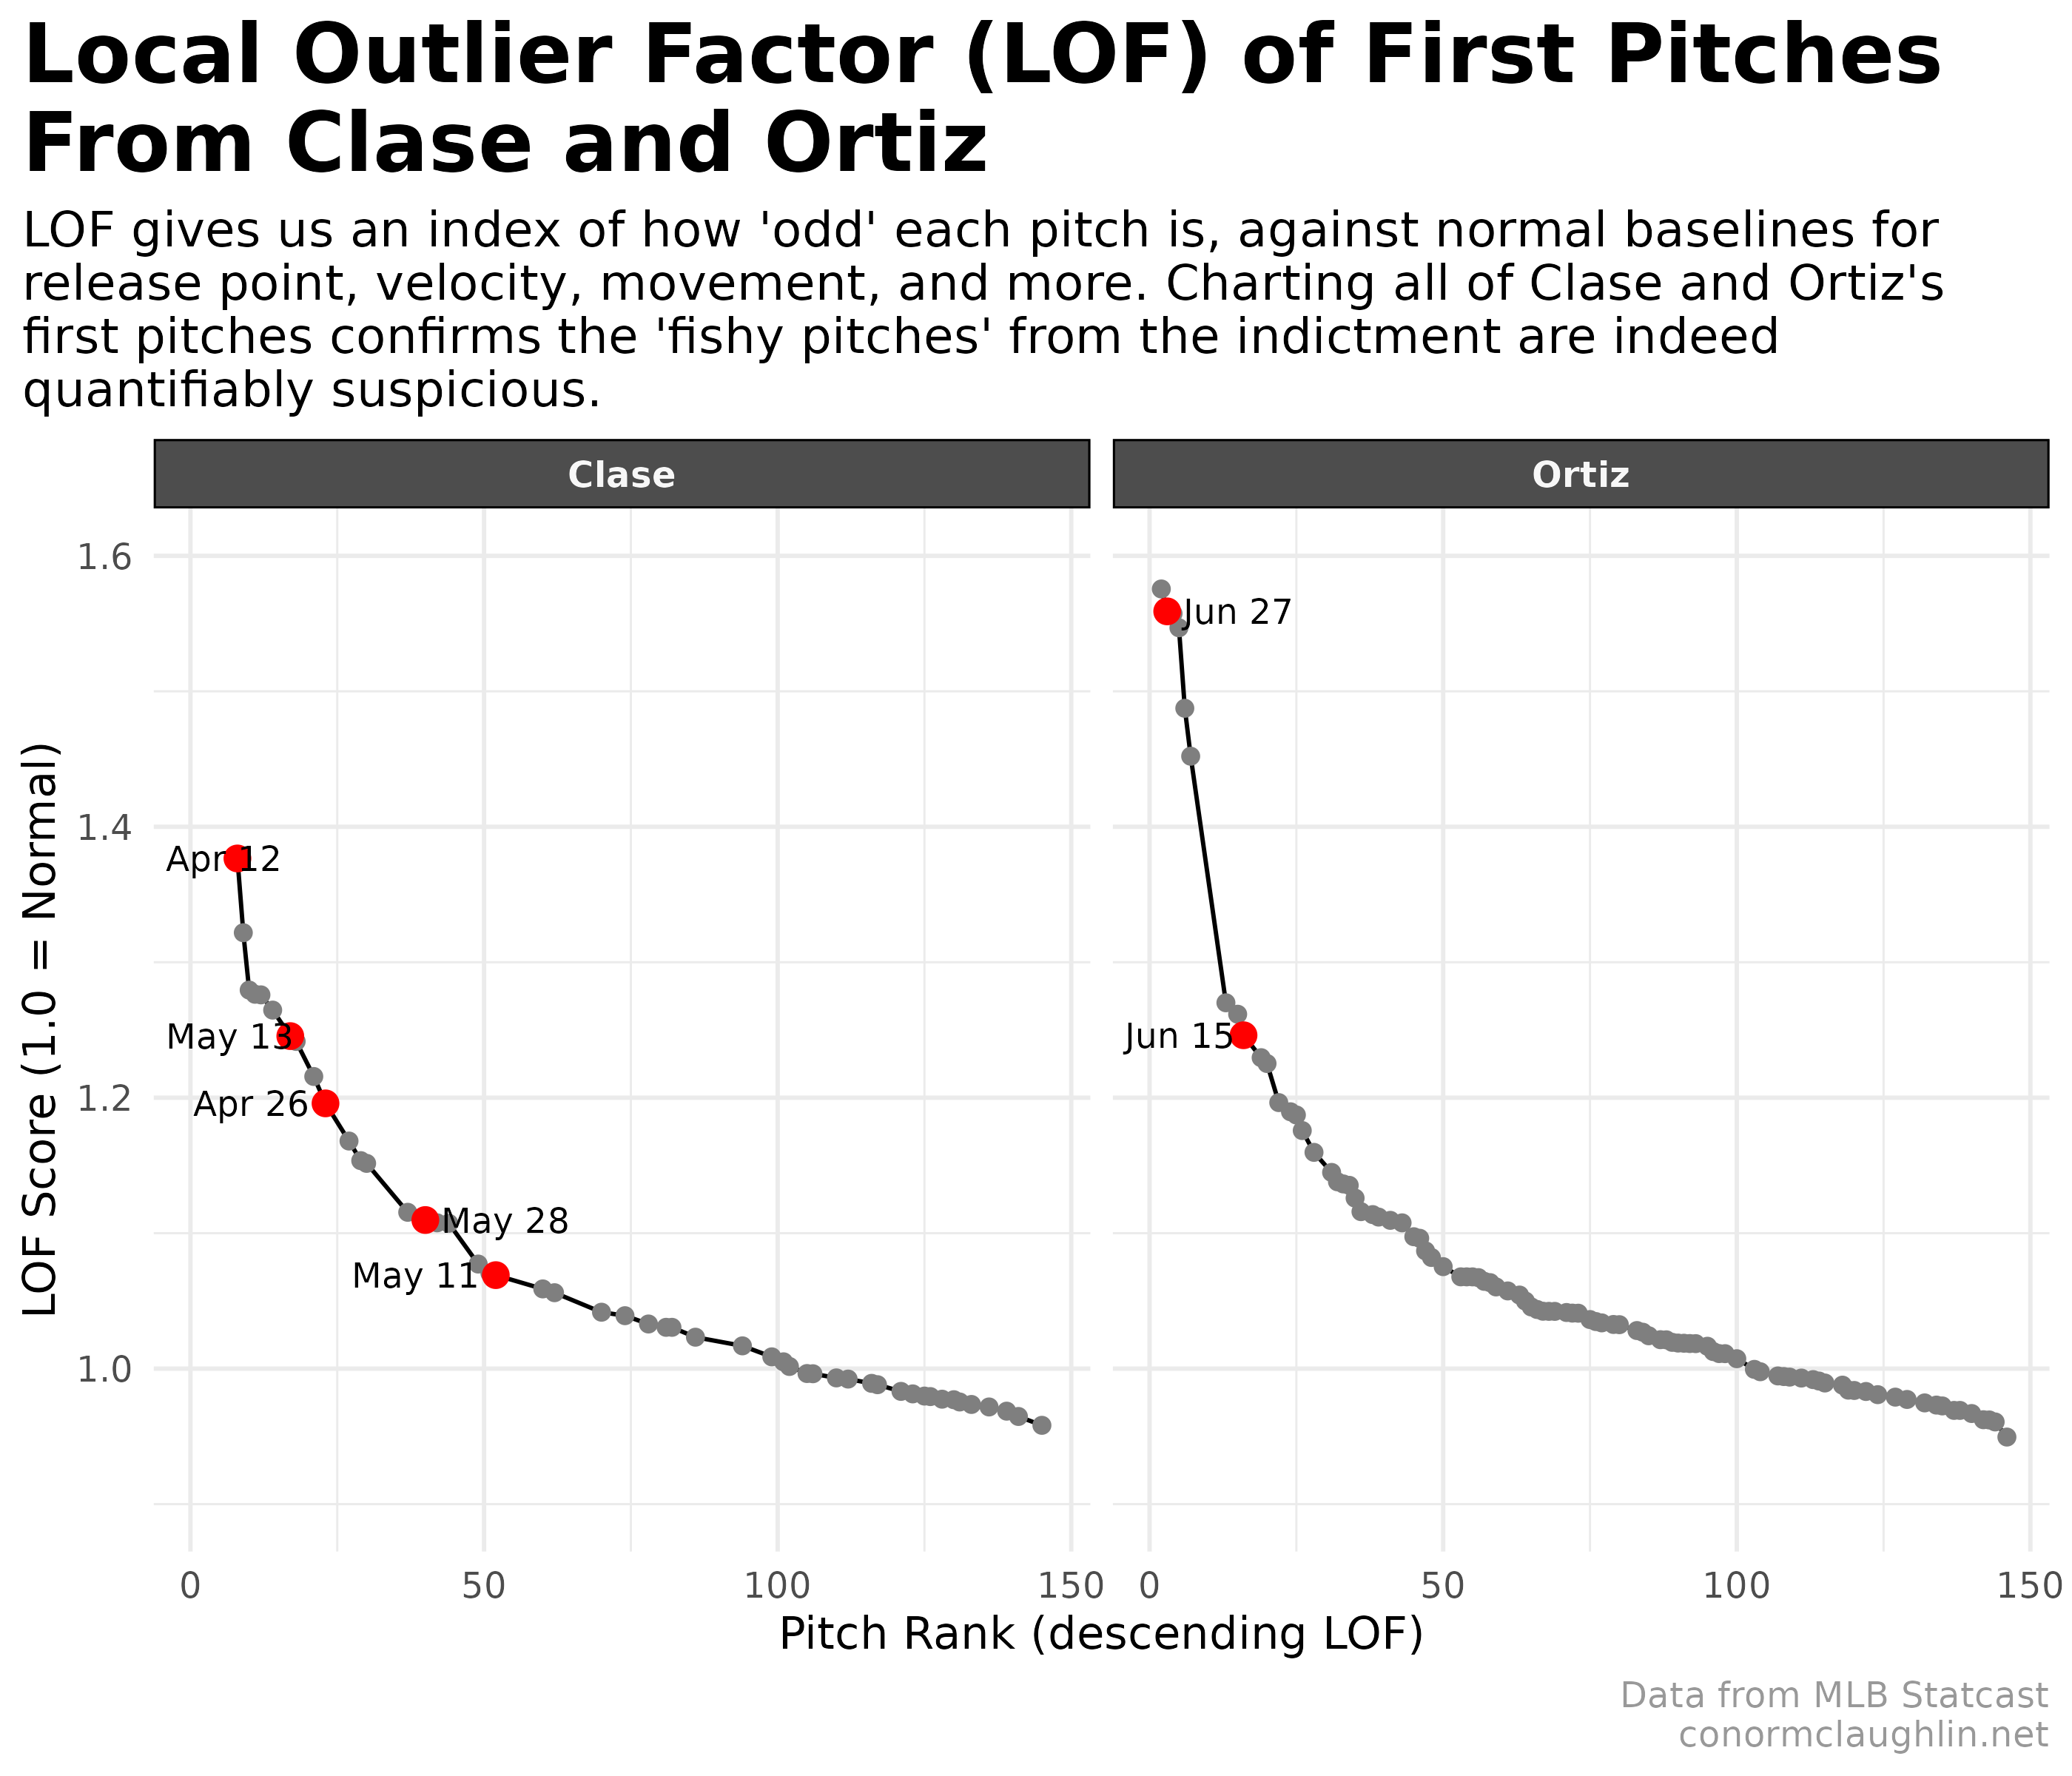
To try to quantify how abnormal those pitches are, as a quantitative defense against the “it could be chance” argument", I decided to turn to local outlier factor (lof), a measure which provides a rough score for how anomalous a given datapoint is, with respect to the other datapoints around it.
I implemented the LOF score by creating an embedding space of pitch data, with Statcast variables for release_speed, release_spin_rate, release_pos_x, release_pos_y, release_pos_z, pfx_x, pfx_z, plate_x, and plate_z creating the space, and dbscan serving as the cluster analysis tool to compute distance to nearest neighbors.
library(dbscan)

clase_pitches_2025 <- clase_pitches_2025 %>%
  left_join(
    clase_pitches_2025 %>%
      filter(is_first_pitch) %>%
      mutate(
        lof_score = {
          X <- select(., release_speed, release_spin_rate,
                         release_pos_x, release_pos_y, release_pos_z,
                         pfx_x, pfx_z, plate_x, plate_z) %>%
               scale() %>% as.matrix()
          dbscan::lof(X, k = 20)
        }
      ) %>%
      select(game_pk, at_bat_number, pitch_number, lof_score),
    by = c("game_pk", "at_bat_number", "pitch_number")
  )
The LOF scores seem to indicate what we hoped we would find - the pitches from the indictment generally show up as very different from the other pitches they threw.
Pitch Location with LOF Score
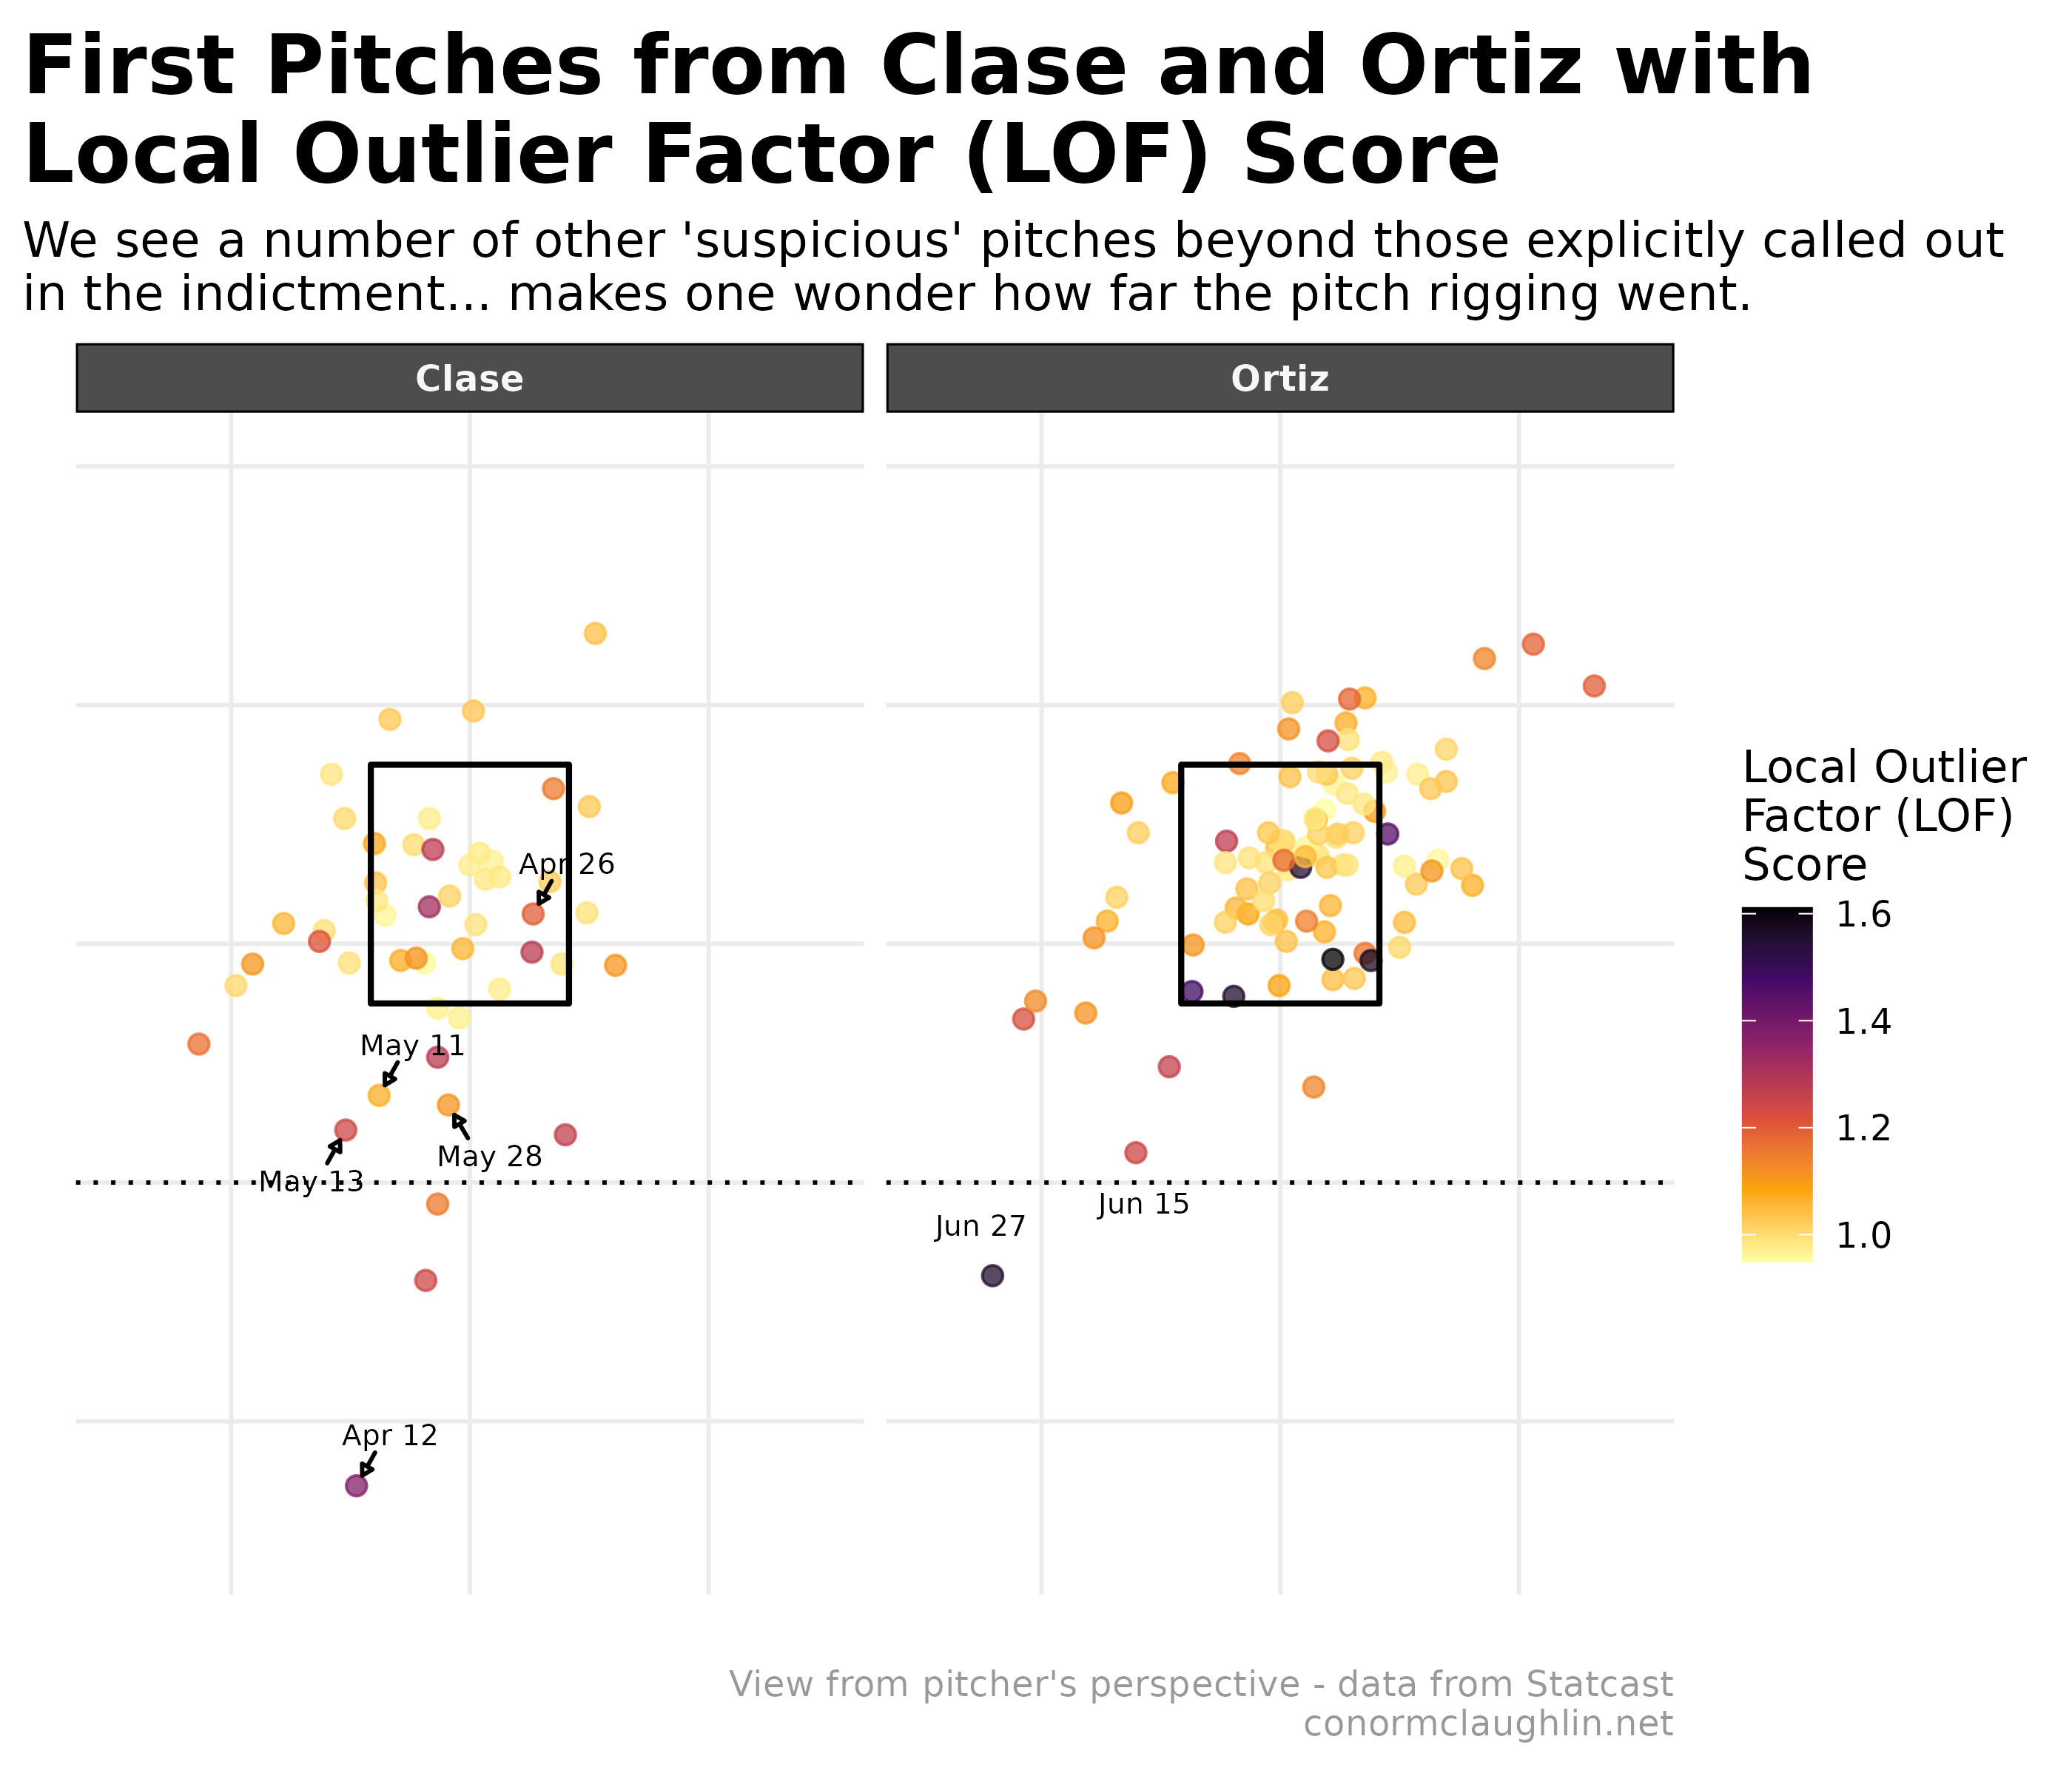
When the LOF scores are incorporated back into the pitch chart view, it is apparent that more shadiness may have been happening on top of the specific pitches called out in the indictment: there are a number of other pitches, out of the zone, which the model flags as notable outliers.
Interestingly, it also flags a few pitches thrown by Ortiz along the bottom edge of the strike zone as significant anomalies… I was able to investigate those, and believe they are being flagged for being thrown meaningfully slower than other pitches! Since the bettors had a history of betting on both Ball or Strike and Pitch Velocity, my guess is that they all thought that this was a sneakier way of fixing the pitches. Not on my watch!
| LOF Group | Pitches | Avg Velo (mph) |
|---|---|---|
| Normal (<1.1) | 1555 | 91.83 |
| Medium (1.1–1.3) | 20 | 92.49 |
| High (>1.3) | 7 | 88.79 |
Release Point
The final exploration I did was around release points, with the belief that the janky pitch locations from the first plot were likely being produced by altered mechanics on the pitch release side of things.
Using Plotly, I built two interactive three-dimensional plots, which do seem to show that the pitches from the indictment had funky, non-standard release points!
Clase
Ortiz
Code Reference
Code To Fetch/Process Pitches
Grab all Clase Pitches
library(baseballr)

clase_pitches_2025 <- statcast_search_pitchers(
  start_date = "2025-03-25",
  end_date   = "2025-10-31",
  pitcherid  = 661403  # Clase; Ortiz = 682847
)
Keep Pitch Information and Number Pitches per Inning and At-Bat
clase_pitches_2025 <- clase_pitches_2025 %>%
  select(game_date, game_pk, inning, batter, pitcher, pitch_type,
         release_speed, release_spin_rate, release_pos_x, release_pos_y, release_pos_z, release_extension,
         pfx_x, pfx_z,
         plate_x, plate_z, type, events,
         balls, strikes, outs_when_up, at_bat_number, pitch_number
  ) %>%
  arrange(game_pk, inning, at_bat_number, pitch_number) %>%
  group_by(game_pk, inning, pitcher) %>%
  mutate(pitch_seq_in_inning = row_number()) %>%
  ungroup() %>%
  mutate(
    is_first_pitch_atbat = (pitch_number == 1),
    is_first_pitch = (pitch_seq_in_inning == 1),
    in_zone = plate_x > -0.83 & plate_x < 0.83 &
              plate_z > 1.5 & plate_z < 3.5,
    non_comp_ball = type == "B" & !in_zone &
                    (abs(plate_x) > 1.5 | plate_z < 1 | plate_z > 4.2)
  )
Tag Pitches Specifically Noted in Indictment
Clase
clase_pitches_2025 <- clase_pitches_2025 %>% mutate(
    highlight_flag =
      (game_date == as.Date("2025-04-12") & pitch_seq_in_inning == 1) |
      (game_date == as.Date("2025-04-26") & pitch_seq_in_inning == 1) |
      (game_date == as.Date("2025-05-11") & pitch_seq_in_inning == 1) |
      (game_date == as.Date("2025-05-13") & pitch_seq_in_inning == 1) |
      (game_date == as.Date("2025-05-28") & pitch_seq_in_inning == 1)
  )
Ortiz
ortiz_pitches_2025 <- ortiz_pitches_2025 %>% mutate(
    highlight_flag =
      (game_date == as.Date("2025-06-27") & inning == 3 & pitch_seq_in_inning == 1) |
      (game_date == as.Date("2025-06-15") & inning == 2 & pitch_seq_in_inning == 1)
  )
Plotly Charts
library(plotly)
library(htmlwidgets)

df <- clase_pitches_2025 %>%
  filter(is_first_pitch) %>%
  mutate(
    highlight_flag =
      (game_date == as.Date("2025-04-12") & pitch_seq_in_inning == 1) |
      (game_date == as.Date("2025-04-26") & pitch_seq_in_inning == 1) |
      (game_date == as.Date("2025-05-11") & pitch_seq_in_inning == 1) |
      (game_date == as.Date("2025-05-13") & pitch_seq_in_inning == 1) |
      (game_date == as.Date("2025-05-28") & pitch_seq_in_inning == 1)
  )

p <- plot_ly(df) %>%
  add_markers(
    data = df %>% filter(!highlight_flag),
    x = ~release_pos_x, y = ~release_pos_y, z = ~release_pos_z,
    marker = list(color = 'lightgrey', size = 4, opacity = 0.5),
    name = "All first-pitch sliders"
  ) %>%
  add_markers(
    data = df %>% filter(highlight_flag),
    x = ~release_pos_x, y = ~release_pos_y, z = ~release_pos_z,
    marker = list(color = 'red', size = 6, opacity = 0.9, symbol = 'circle'),
    text = ~paste0("Date: ", game_date,
                   "<br>Inning: ", inning,
                   "<br>Speed: ", release_speed, " mph",
                   "<br>Extension: ", release_pos_y, " ft"),
    hoverinfo = "text",
    name = "Alleged fixed pitches"
  ) %>%
  layout(
    scene = list(
      xaxis = list(title = "Release X (ft)"),
      yaxis = list(title = "Release Z (ft)"),
      zaxis = list(title = "Release Y (Extension, ft)")
    ),
    title = "Clase’s First Pitch Releases — Highlighted Alleged Intentional Pitches"
  )

saveWidget(
  p,
  file = "clase_release_points.html",
  selfcontained = TRUE
)

p