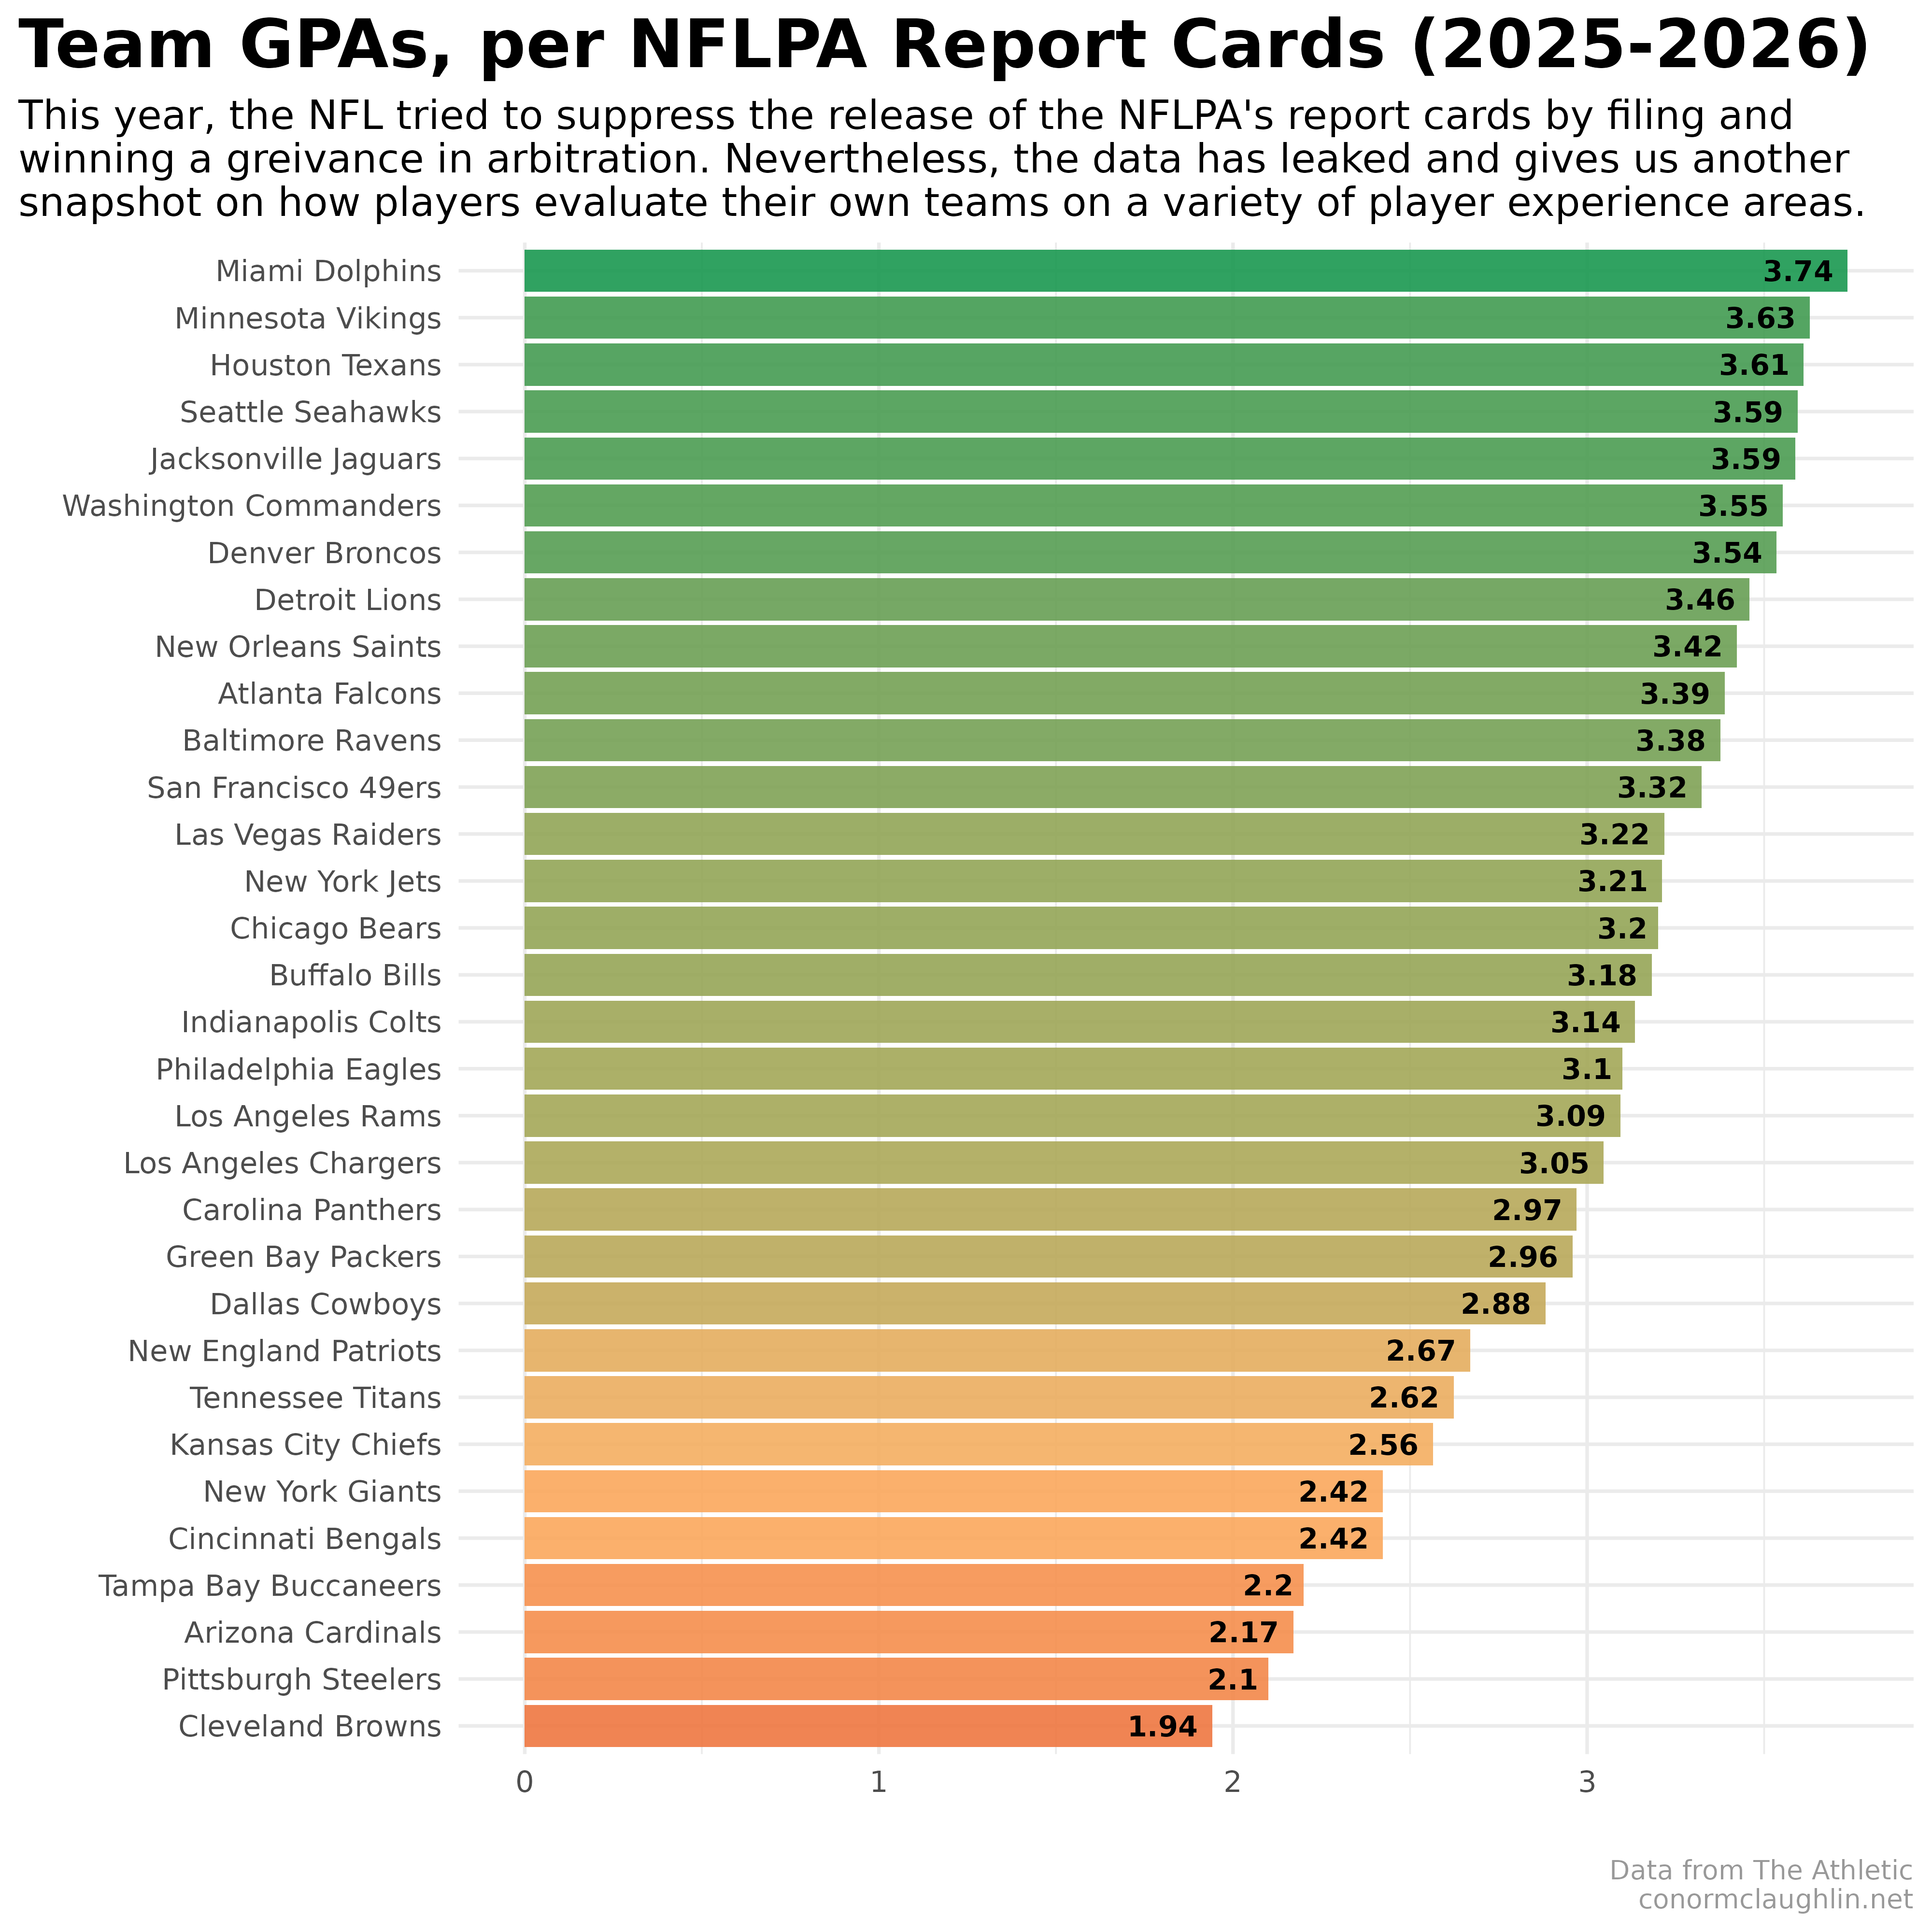
Earlier today, the Team Report Cards compiled by the NFL Players Association (NFLPA) leaked and were published by The Athletic, despite the NFL winning a grievance in arbitration that blocked the NFLPA’s release of the data.
This legal aspect added some intrigue to what has otherwise been a customary dump of data - one that clearly bothers the owners of the NFL’s 32 franchises!
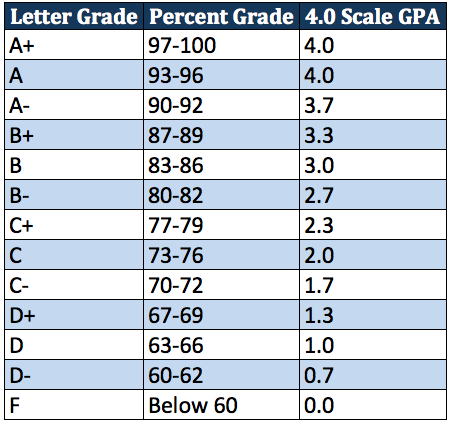
As a reminder, these report cards are where players score their own teams on a variety of player experience dimensions from A+ to F-:
- Treatment of Families
- Food/Cafeteria
- Nutritionist/Dietician
- Locker Room
- Training Room
- Training Staff
- Weight Room
- Strength Coaches
- Team Travel
- Head Coach
- Ownership
This year, there were new categories added for:
- Home Field (surface quality)
- Offensive Coordinator
- Defensive Coordinator
- Offensive Coordinator
- General Manager
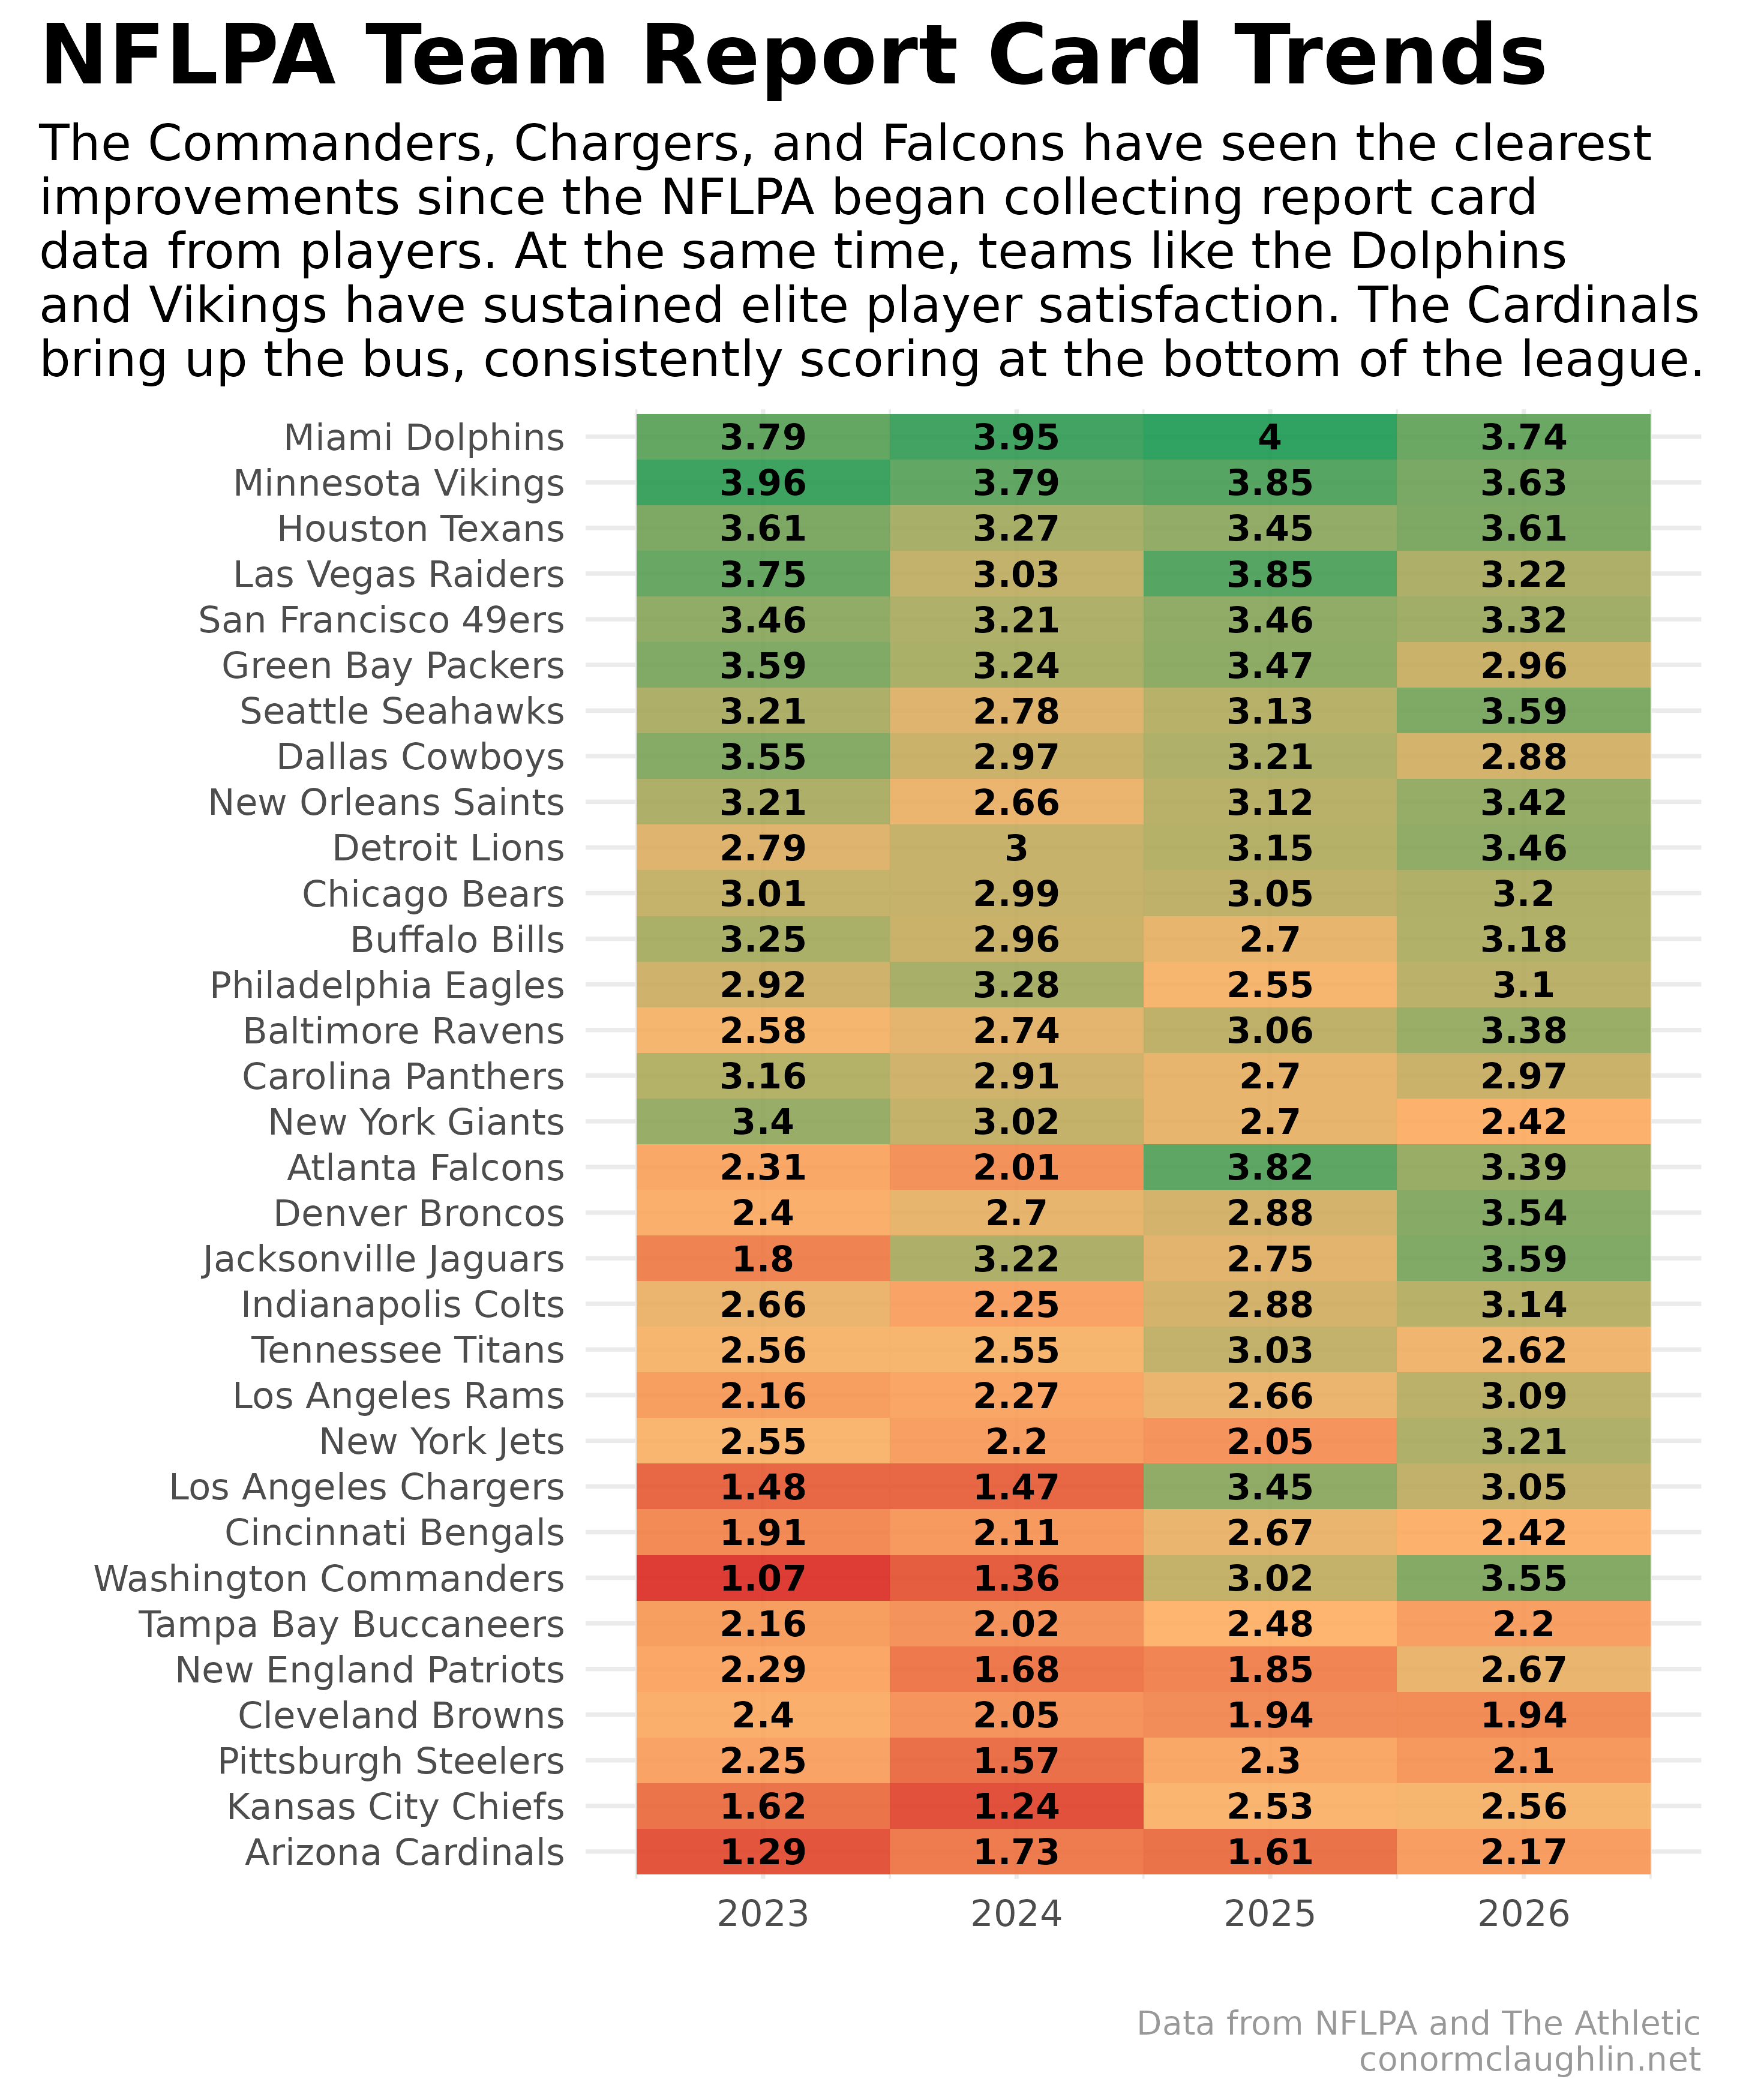
Similar to last year’s update (and the year before, and the year before…), I’ll be utilizing Grade Point Average (GPA) to distill the team grade’s into a single figure per program, and then will bust out the visualizations across all teams and categories.
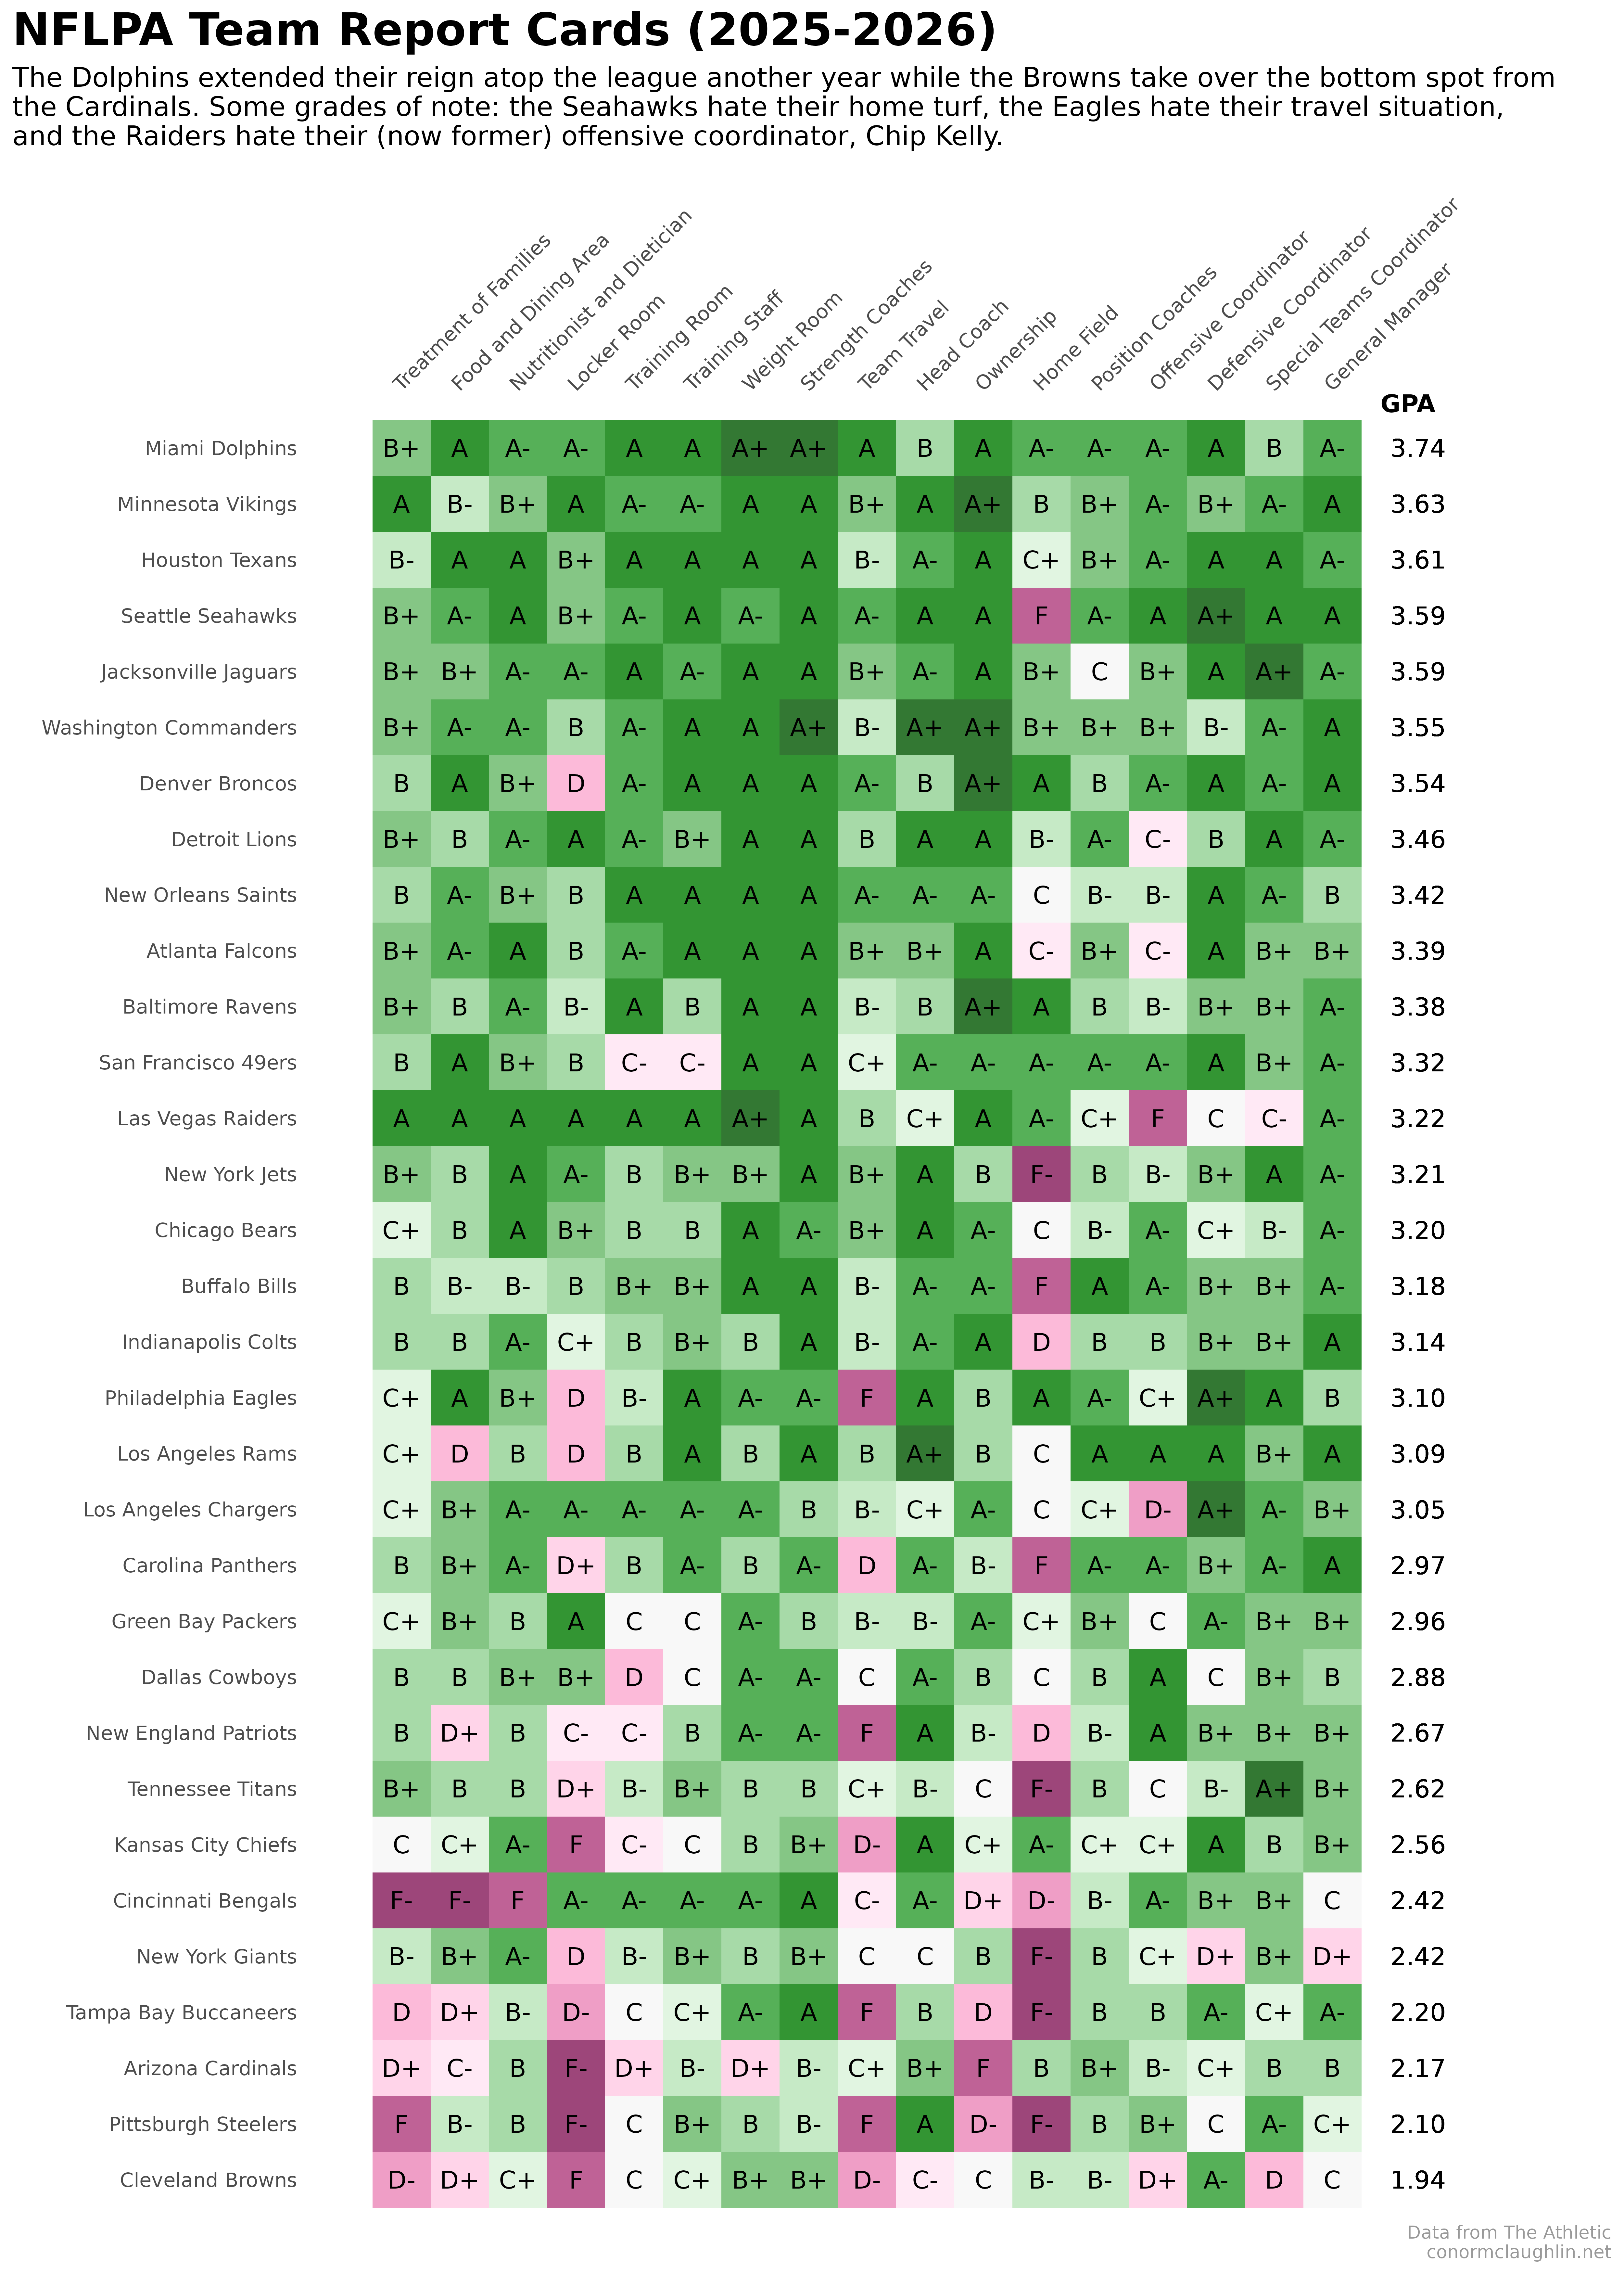
League-Wide Report Cards
Grades Across Categories
Overall Team GPAs
History of Report Cards
Now that we have four full years of report cards to pull on, I thought it would be cool to view the results as a per-team trend, to try to identify programs which are clearly improving. When doing so, three jump out: the Washington Commanders, the Los Angeles Chargers, and the Atlanta Falcons, all of which made big leaps (which have been sustained) in the 2024-2025 season.
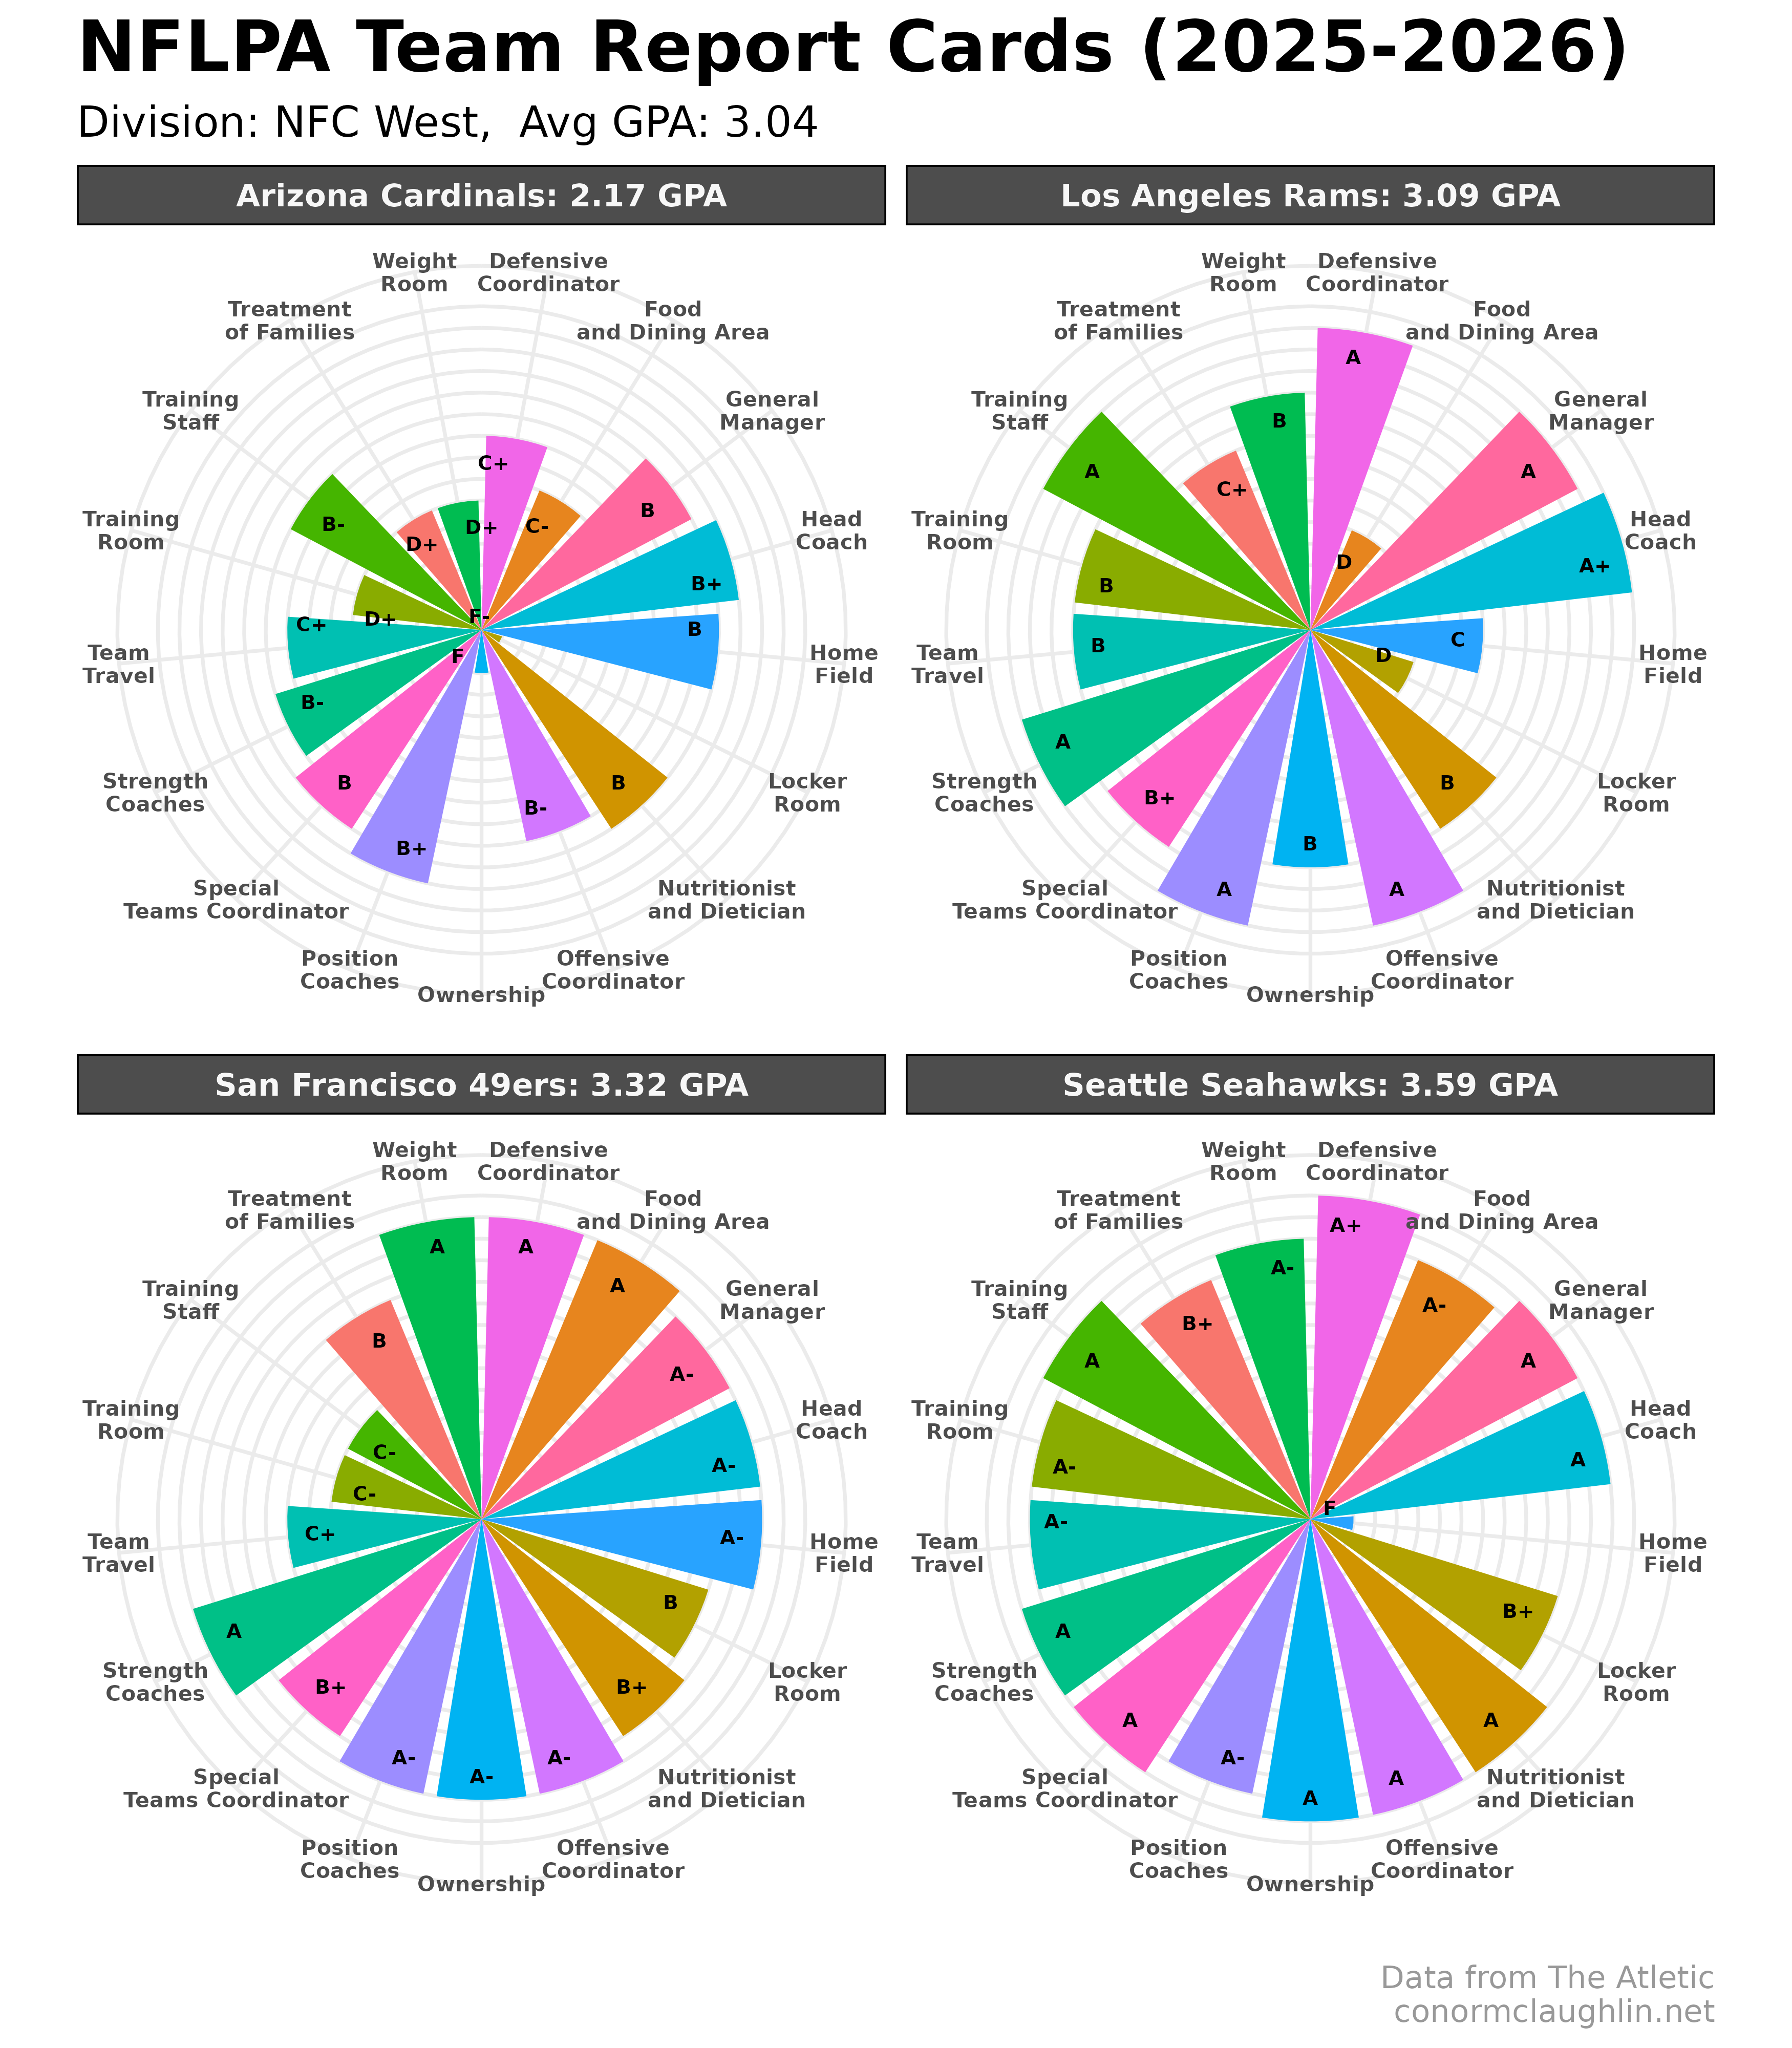
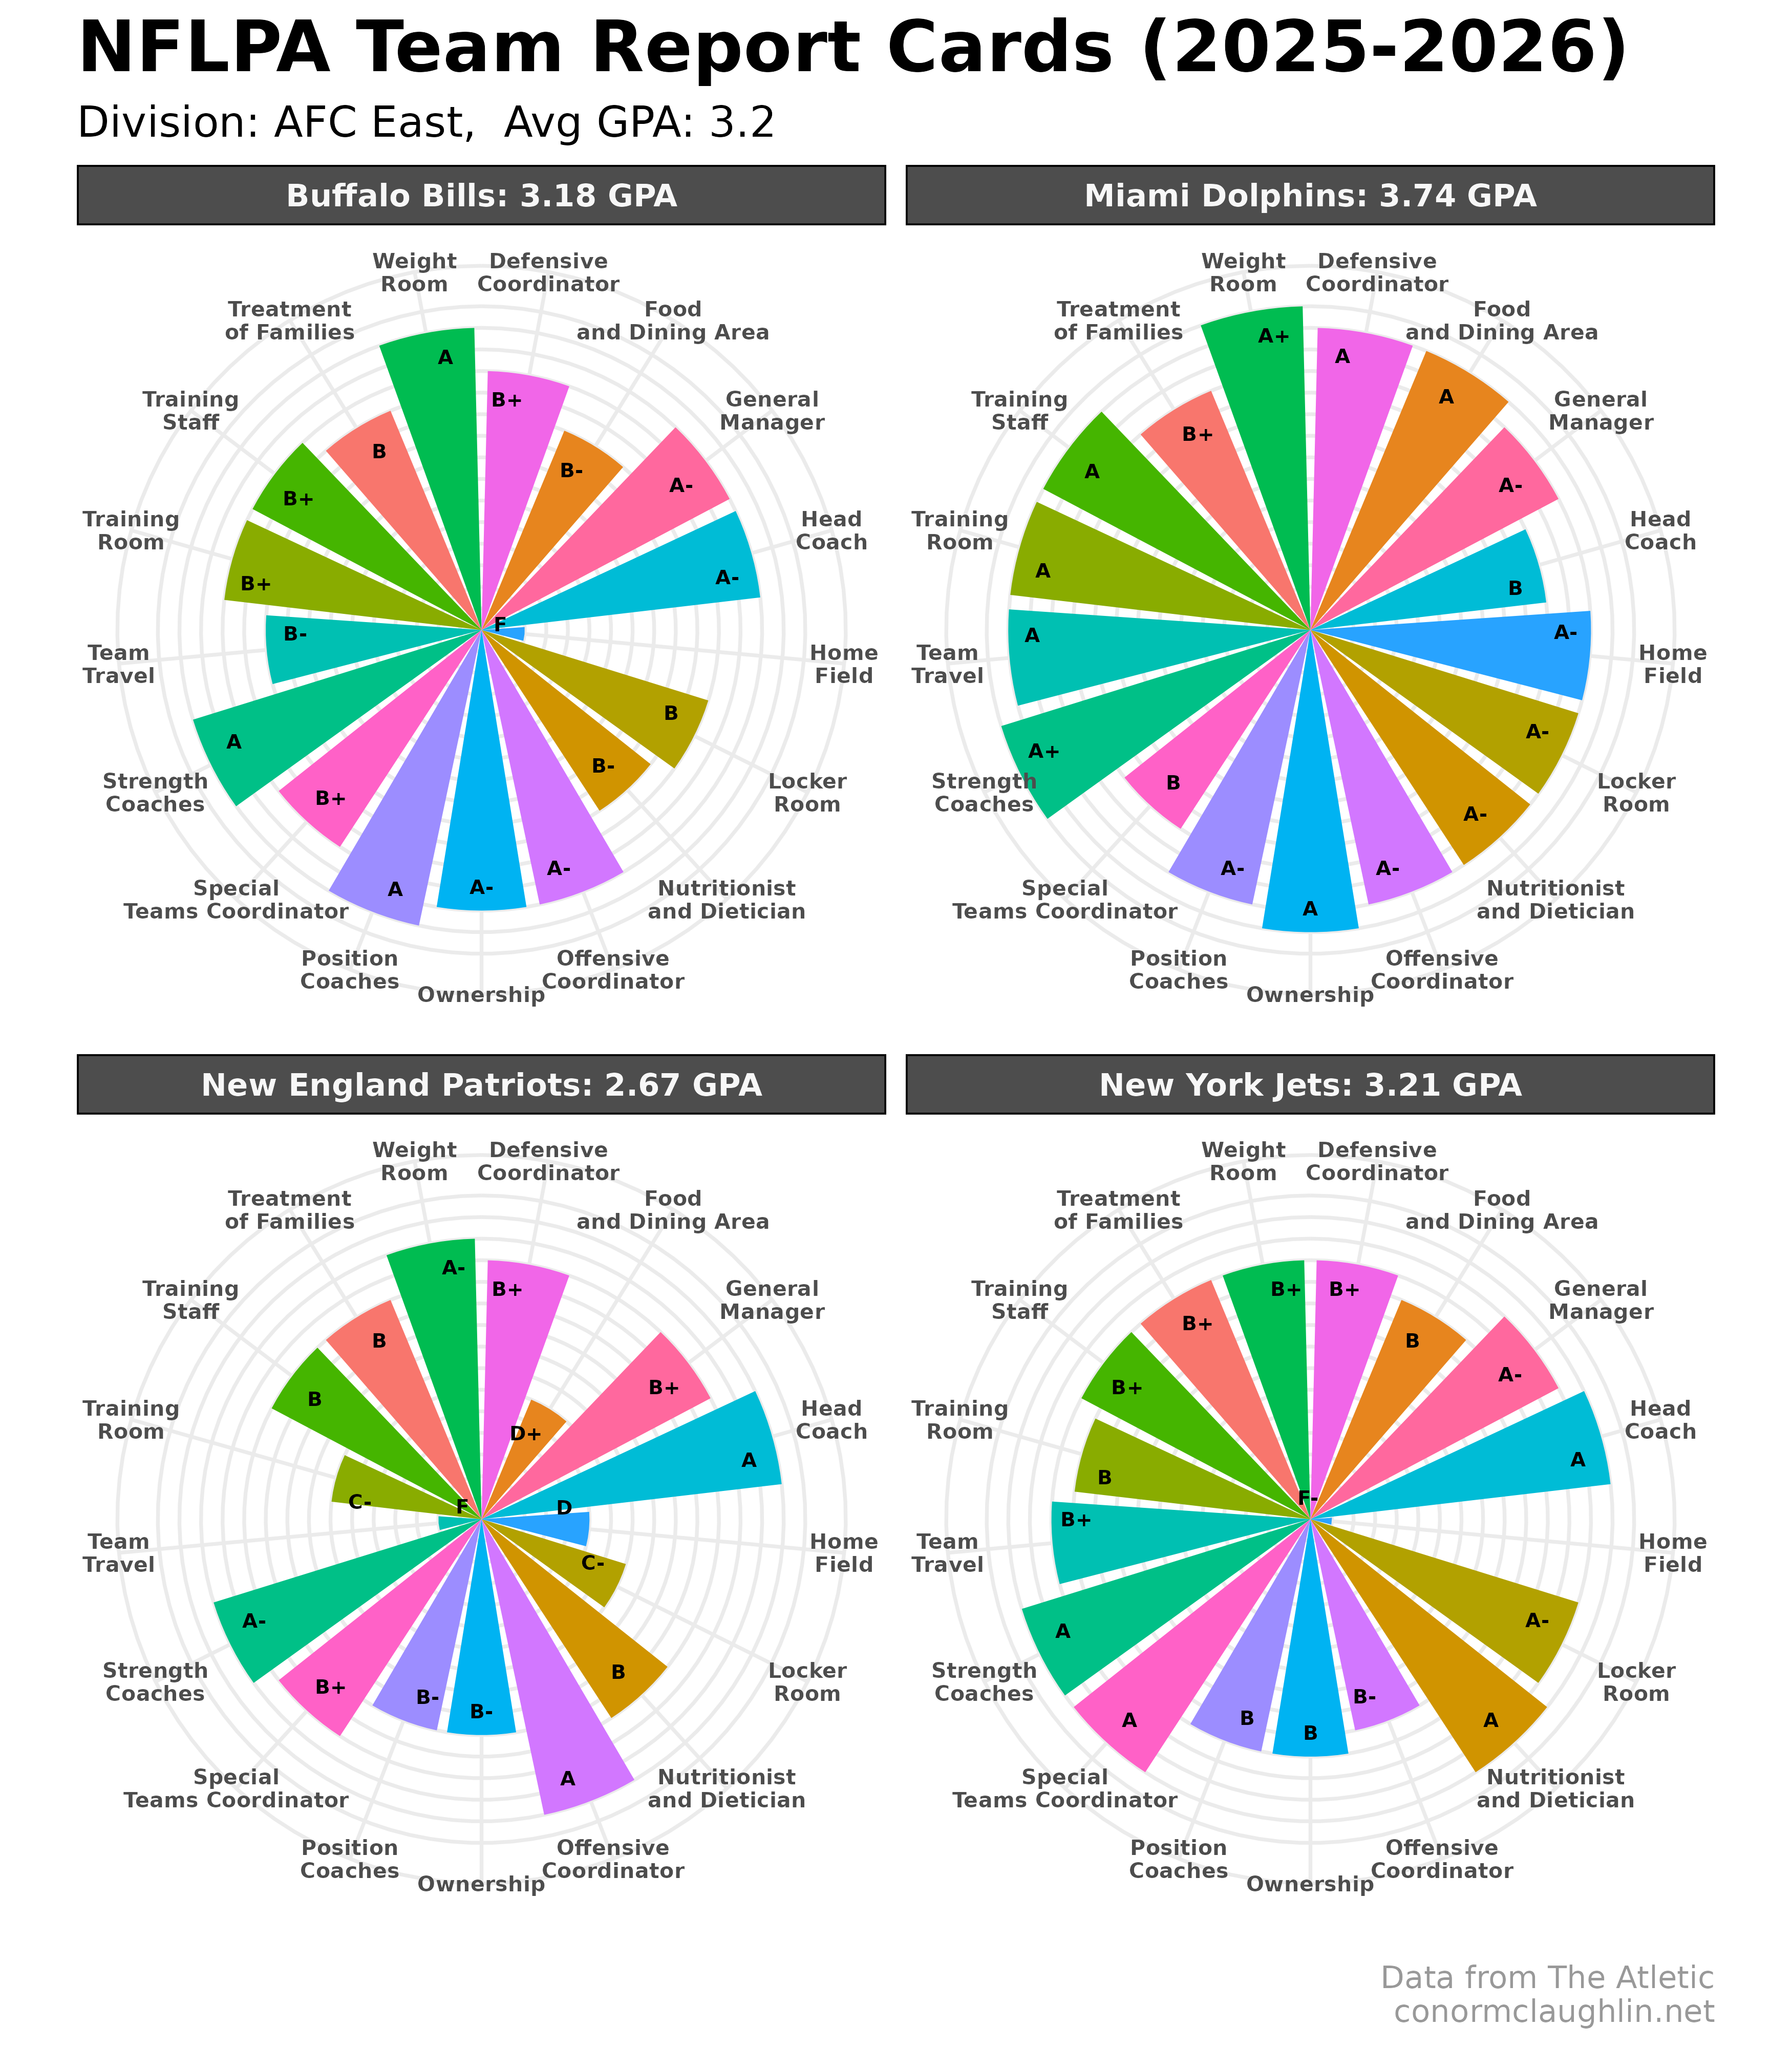
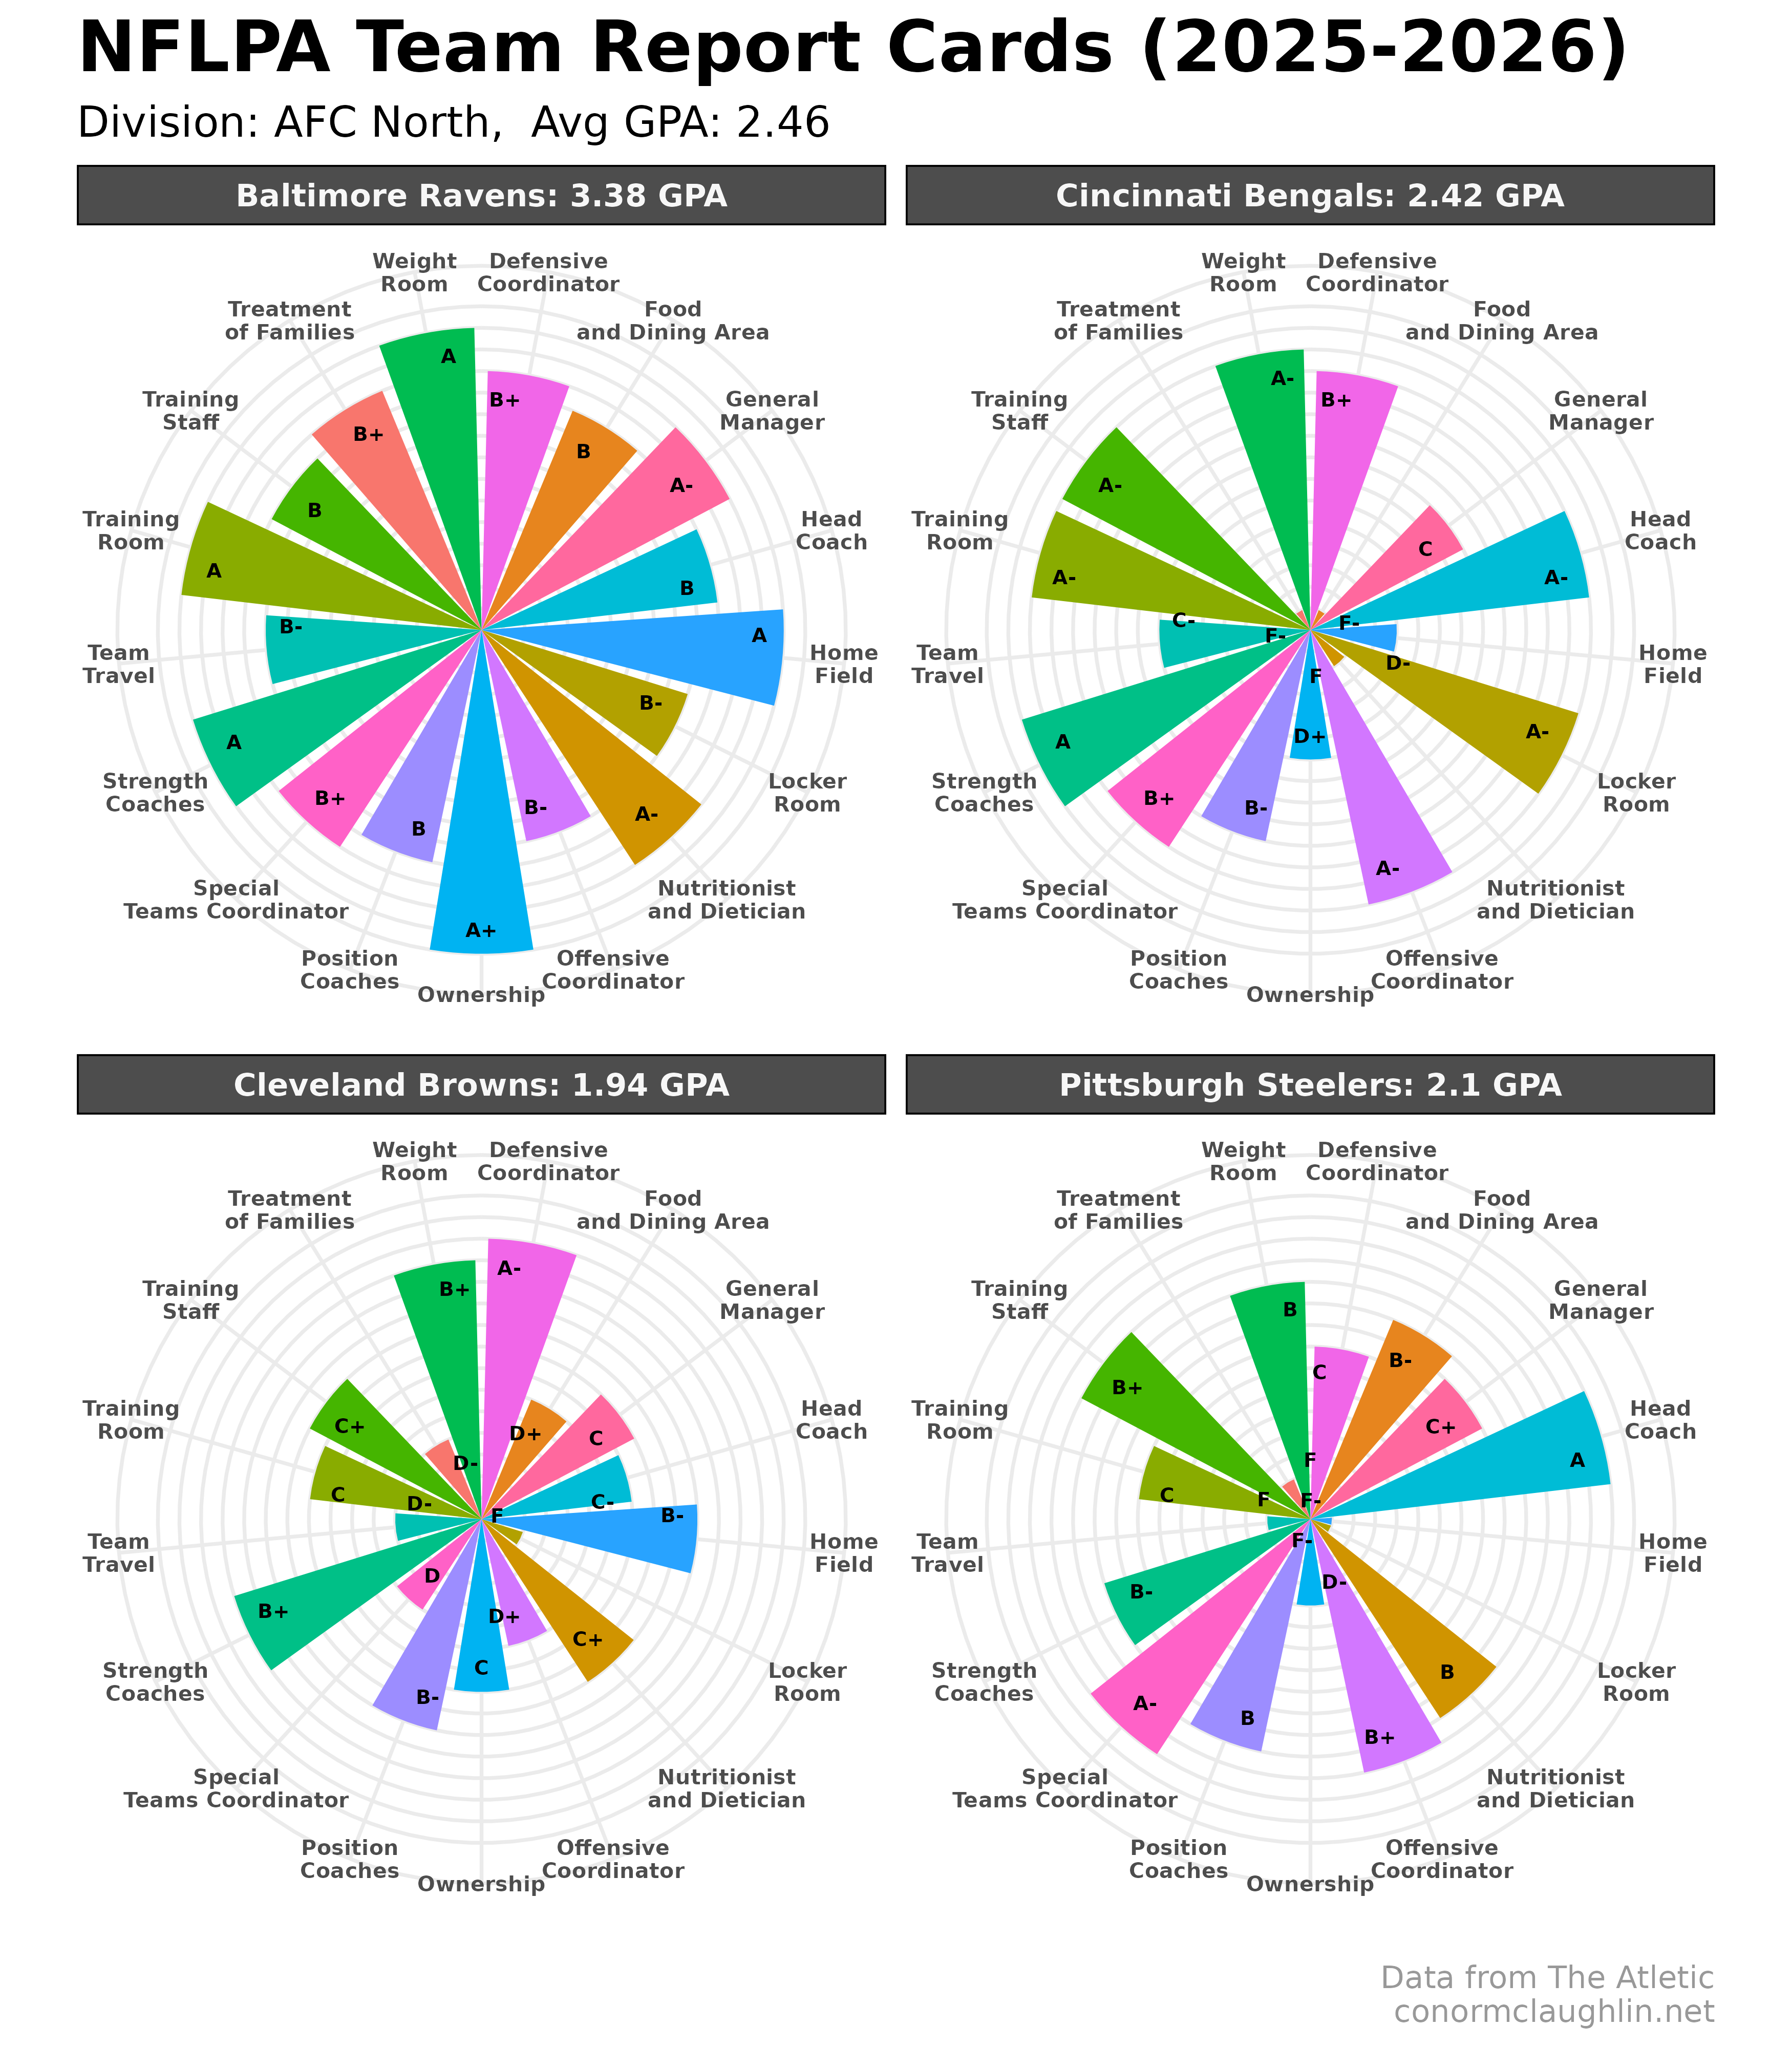
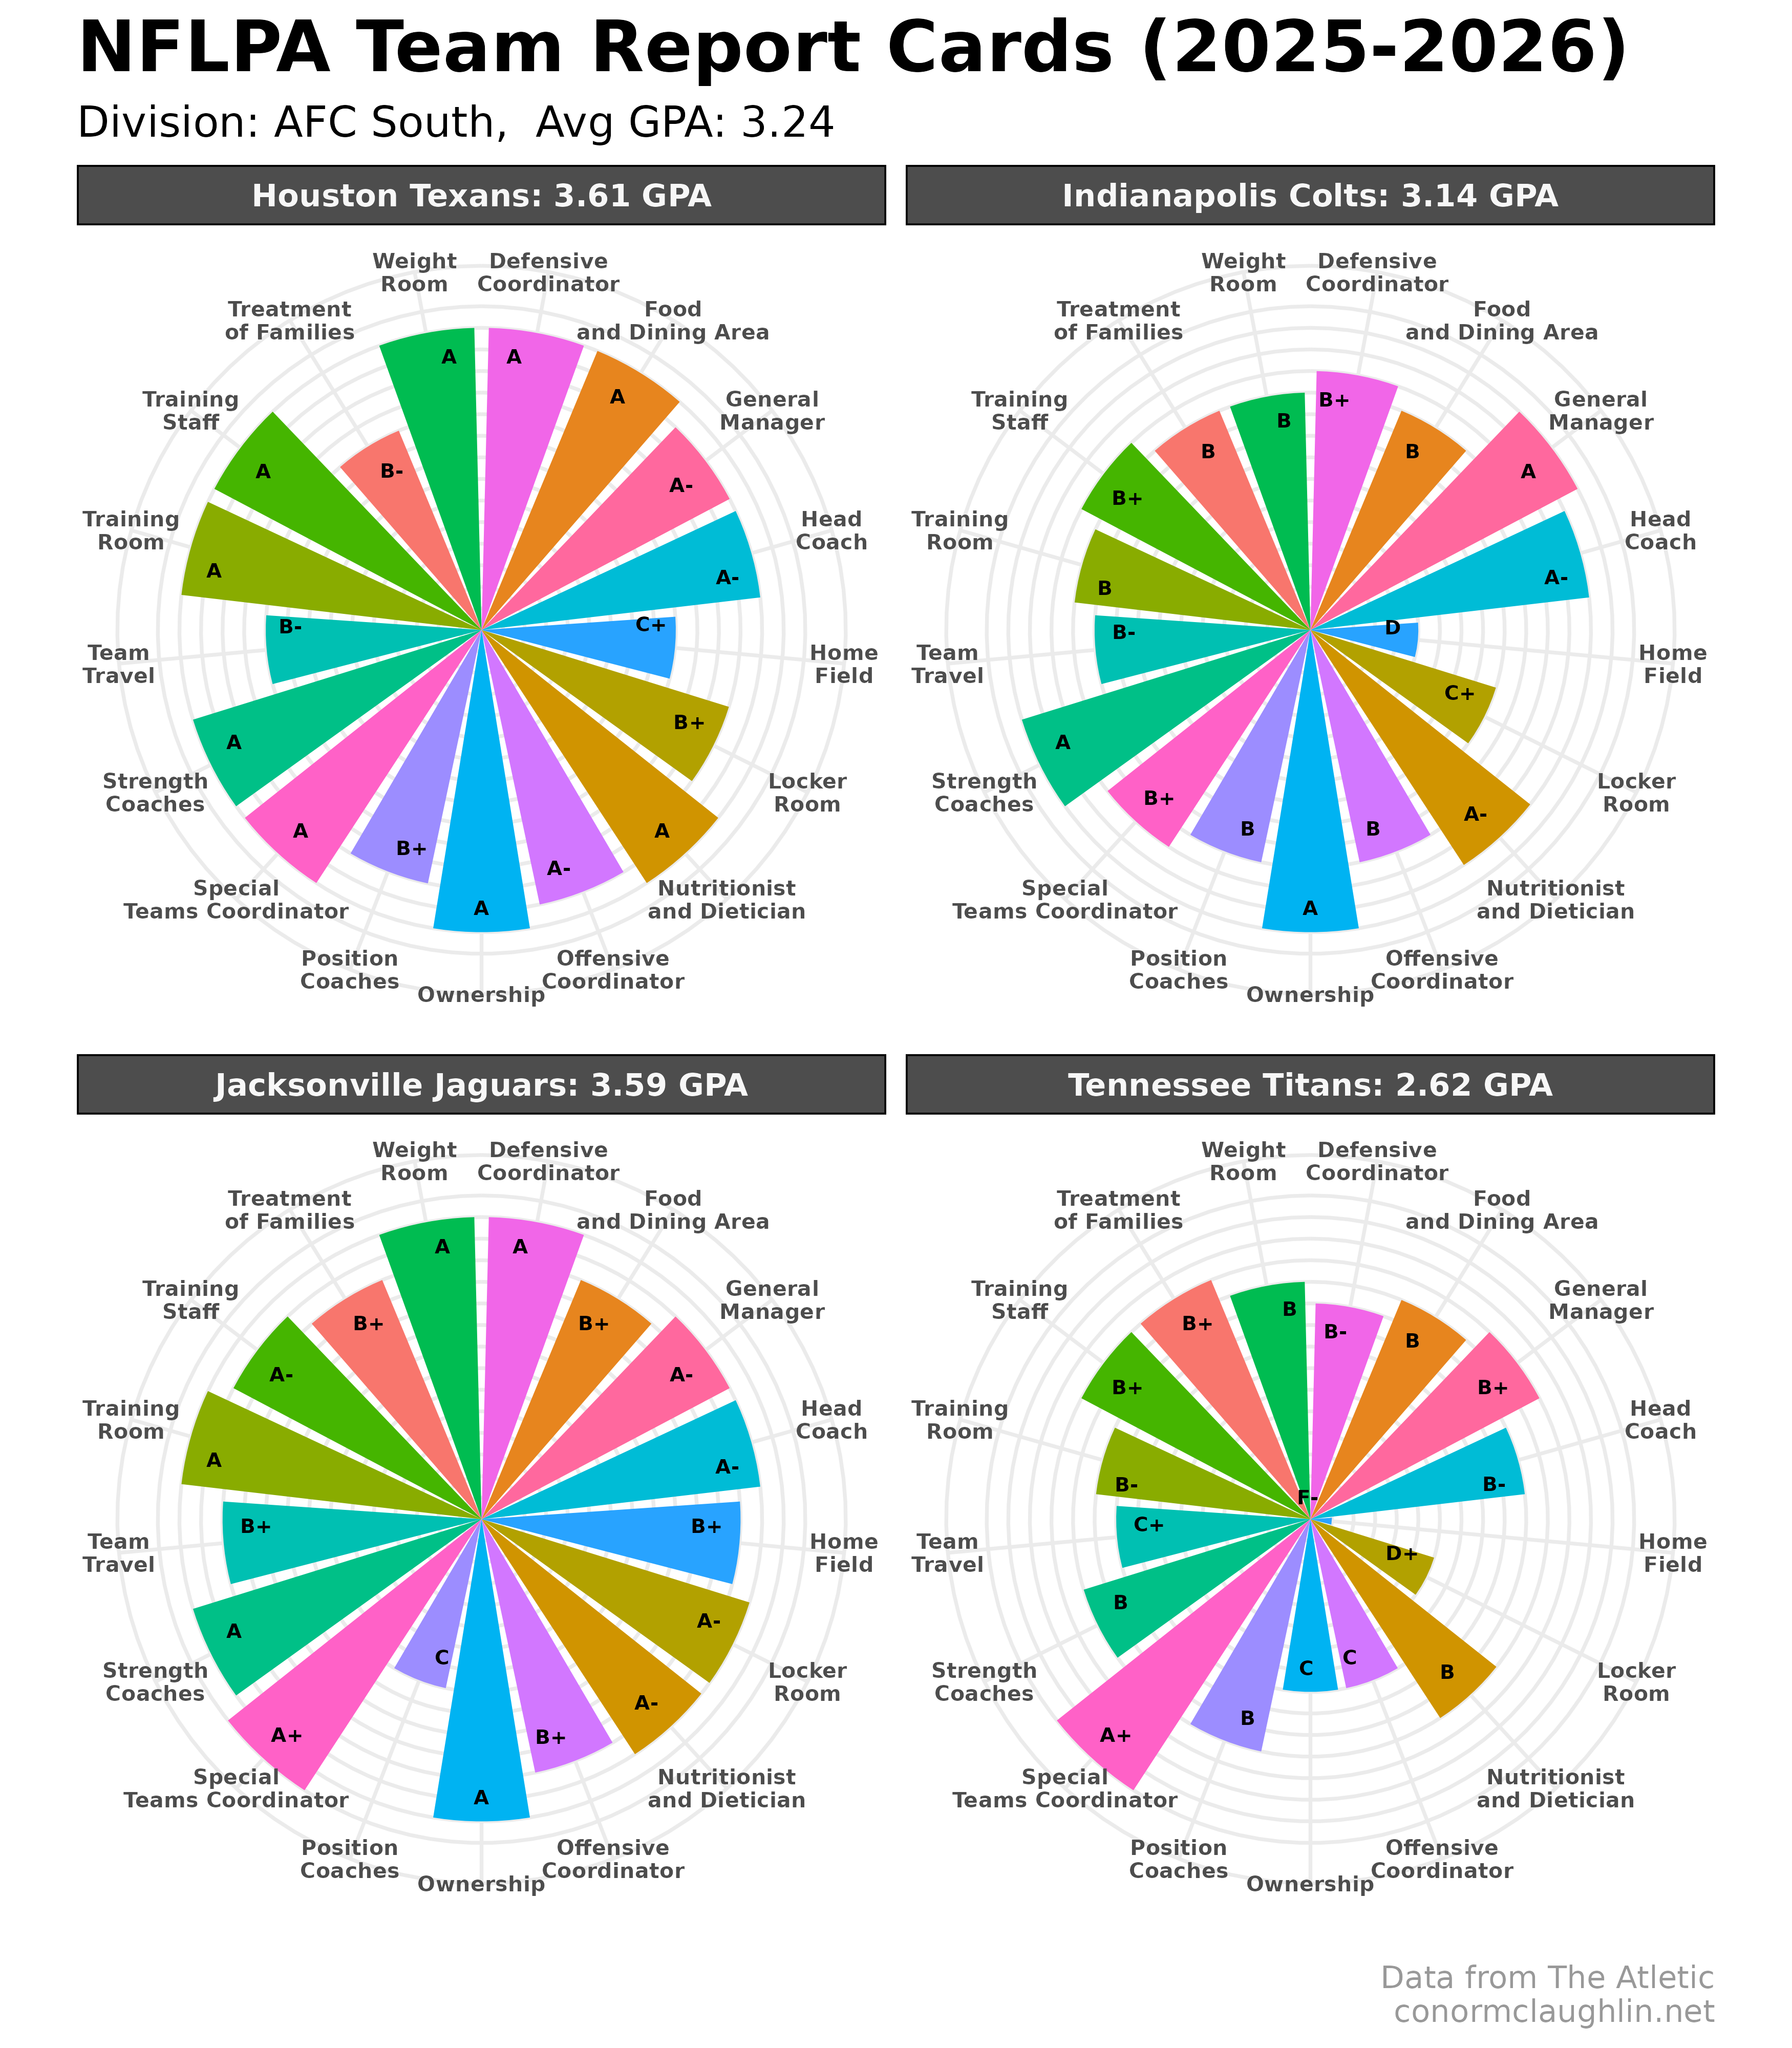
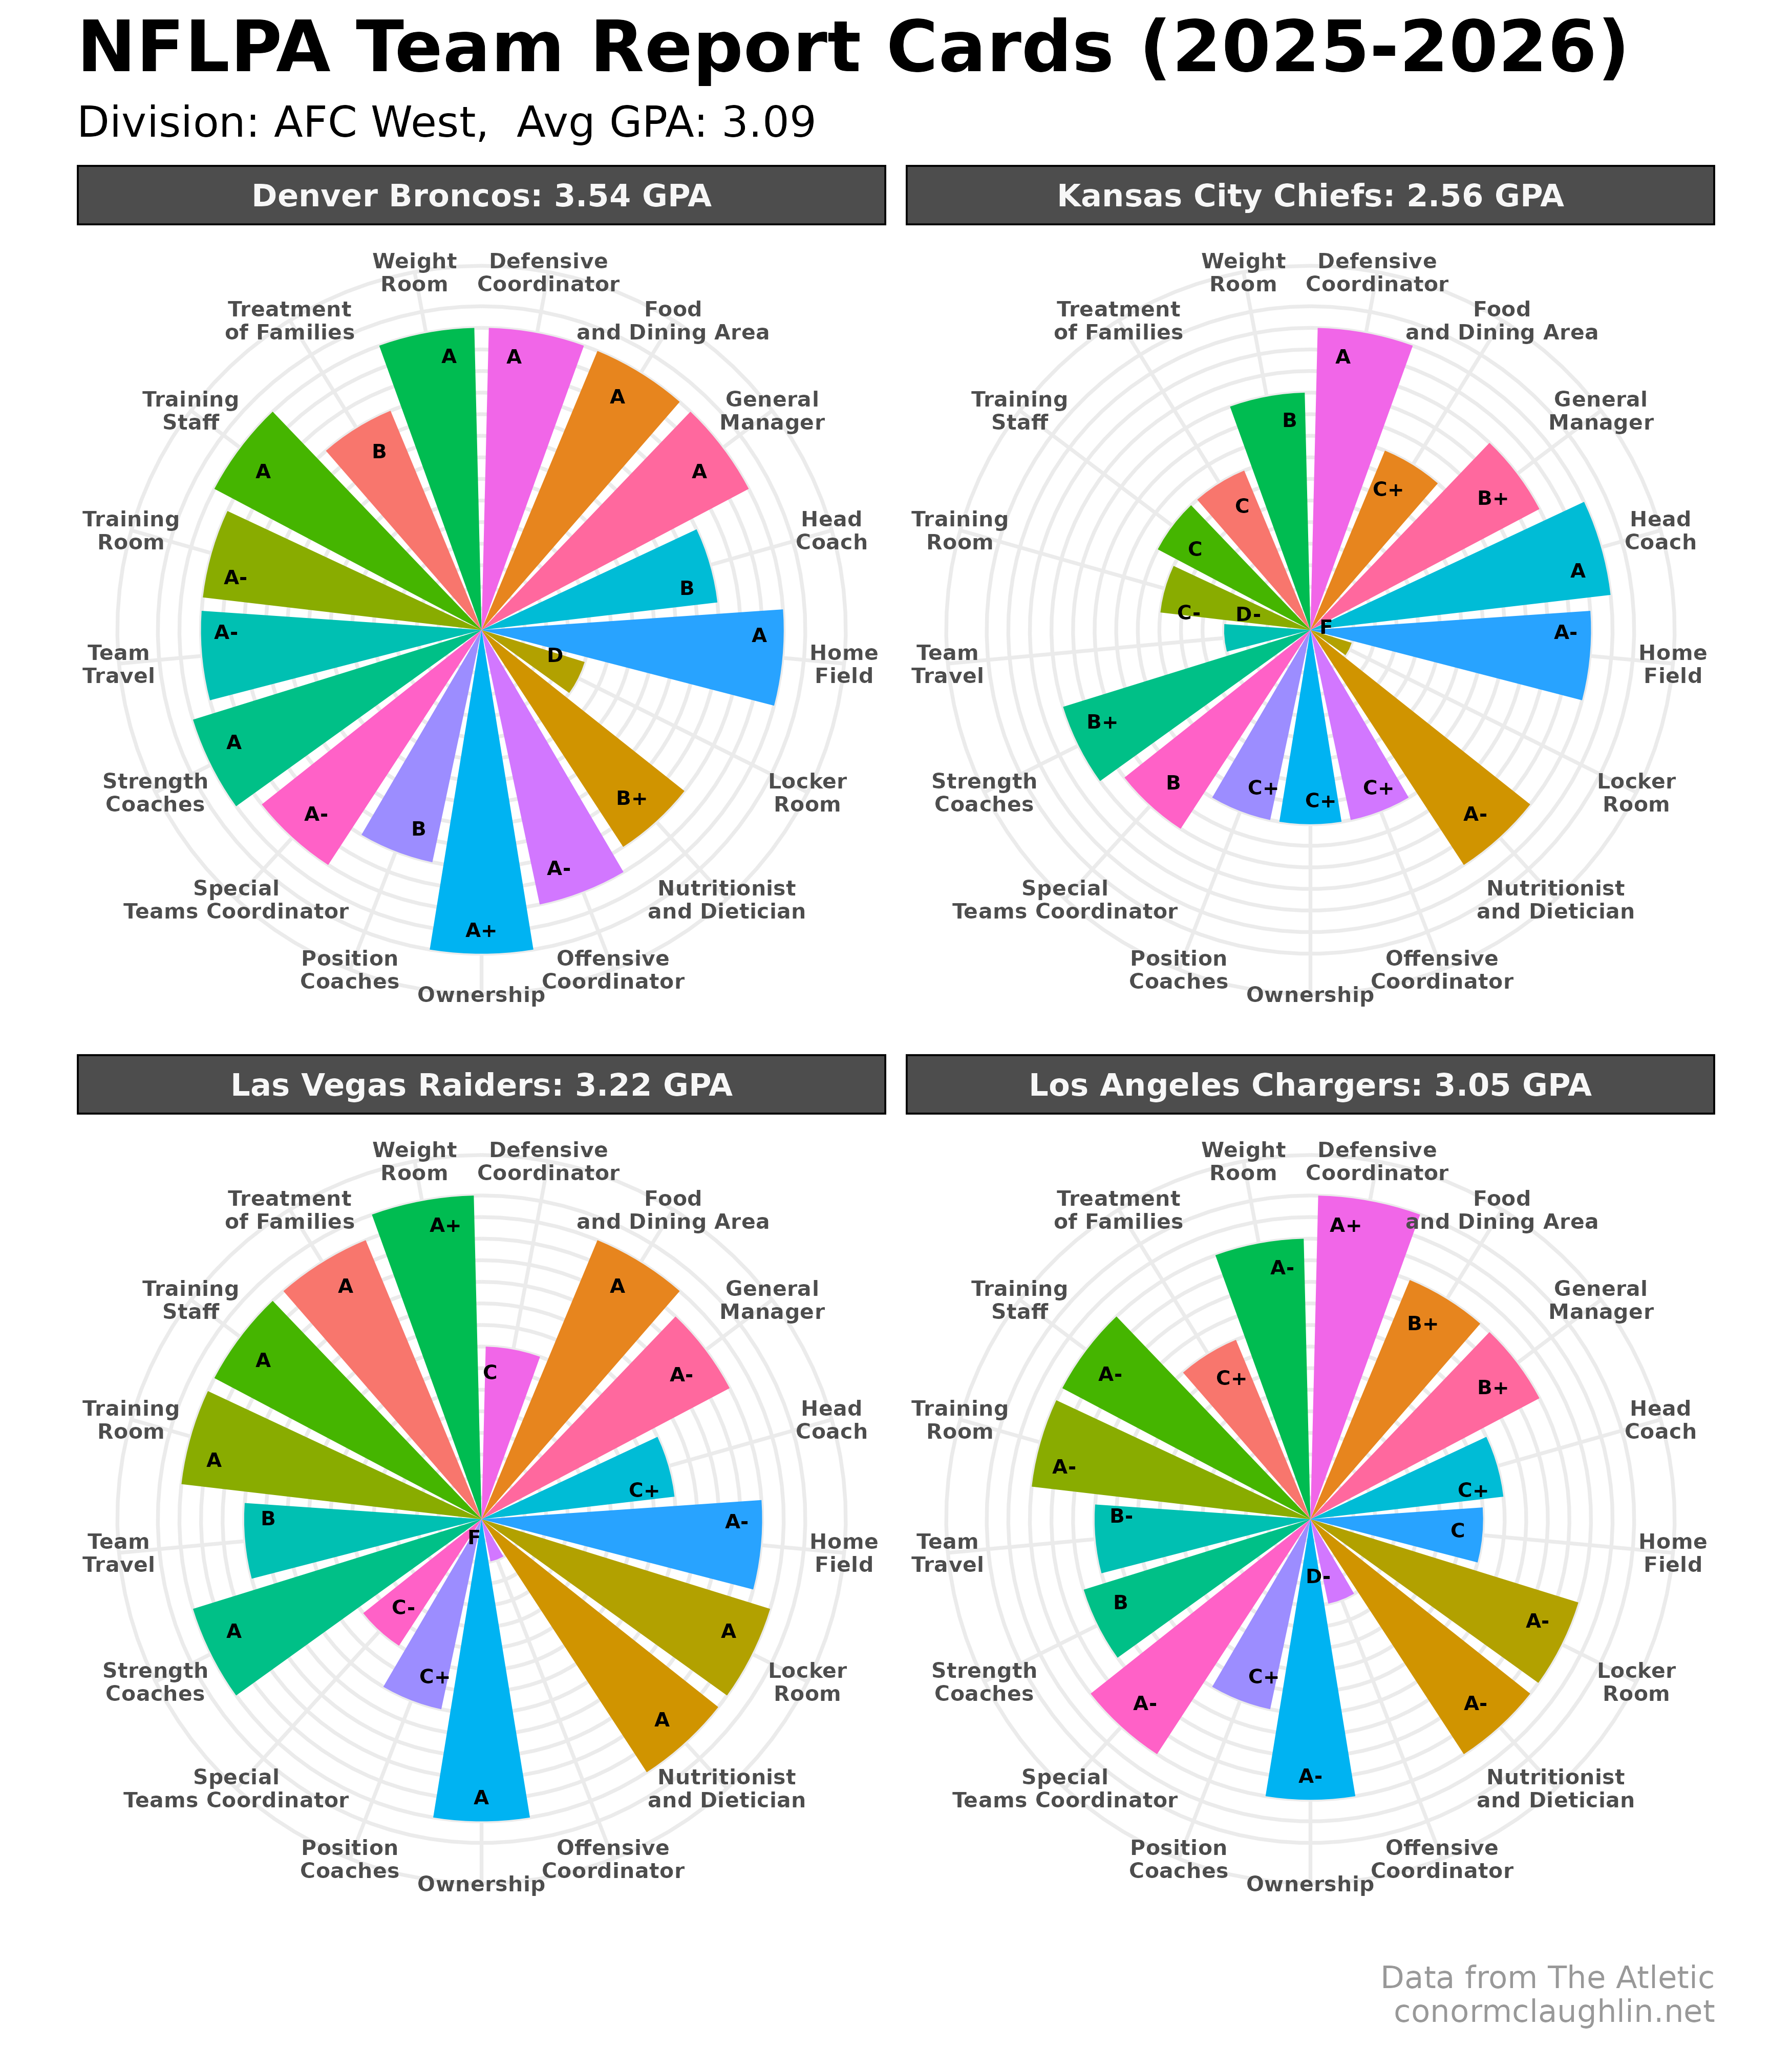
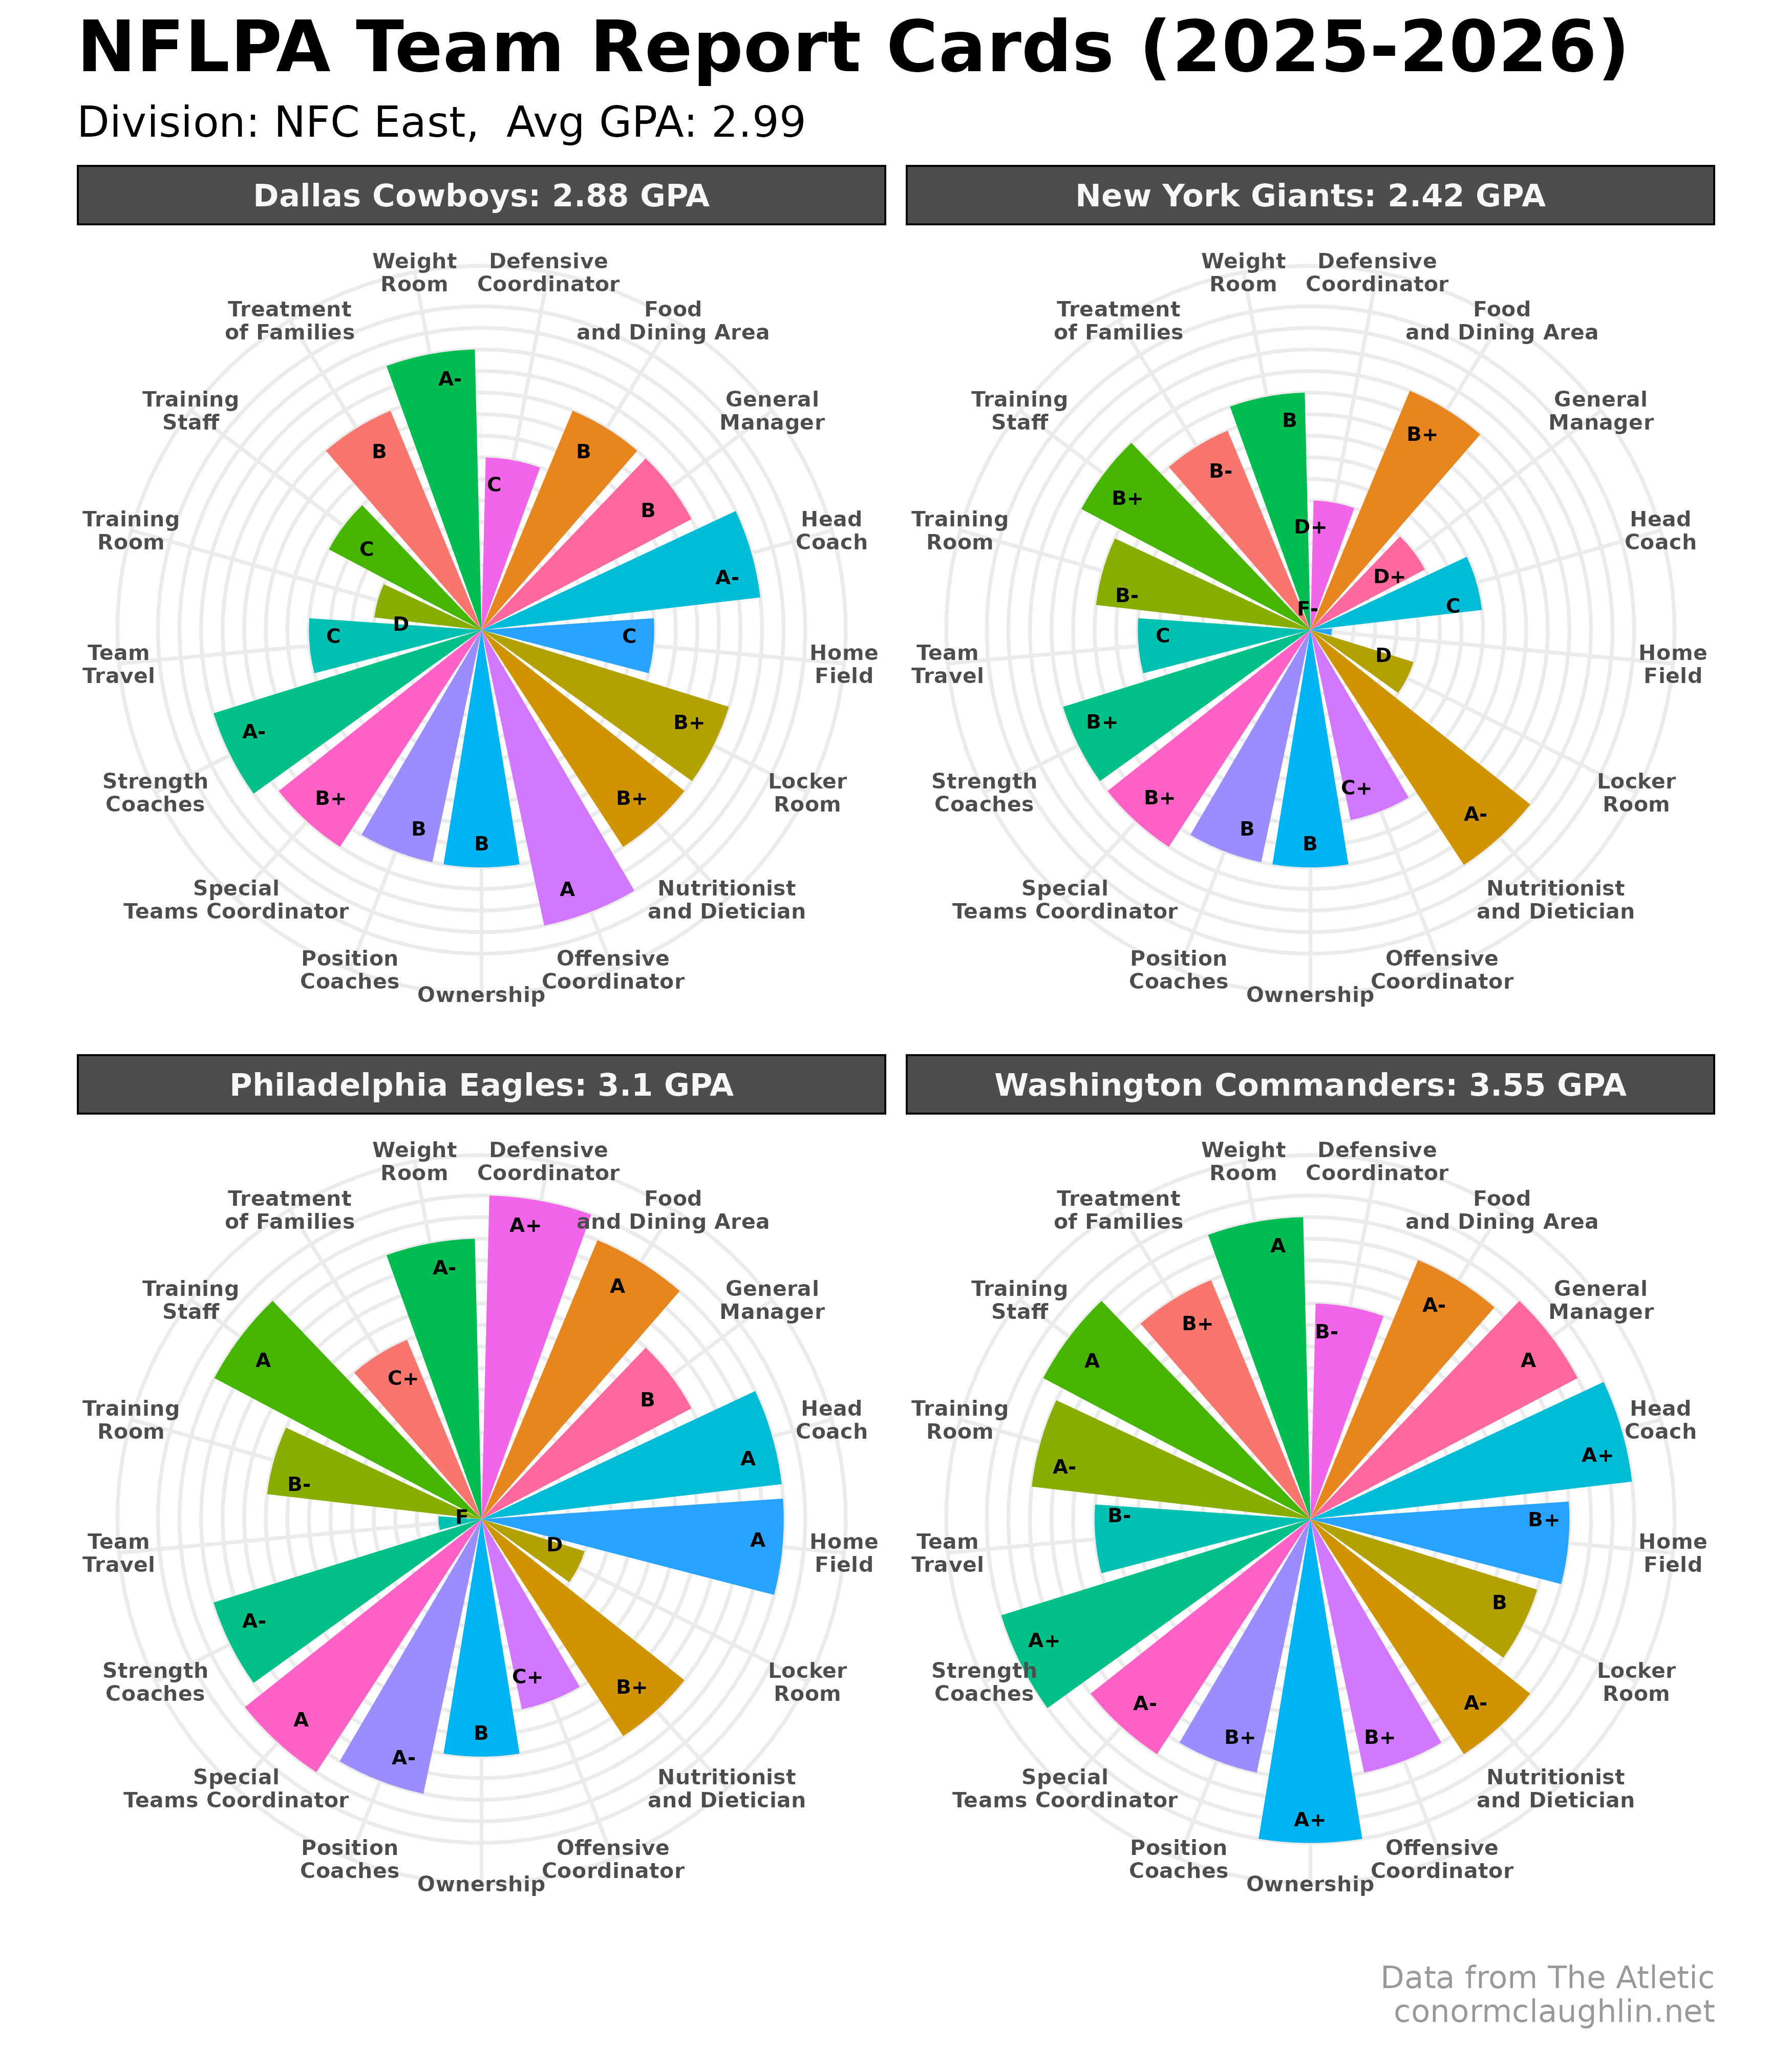
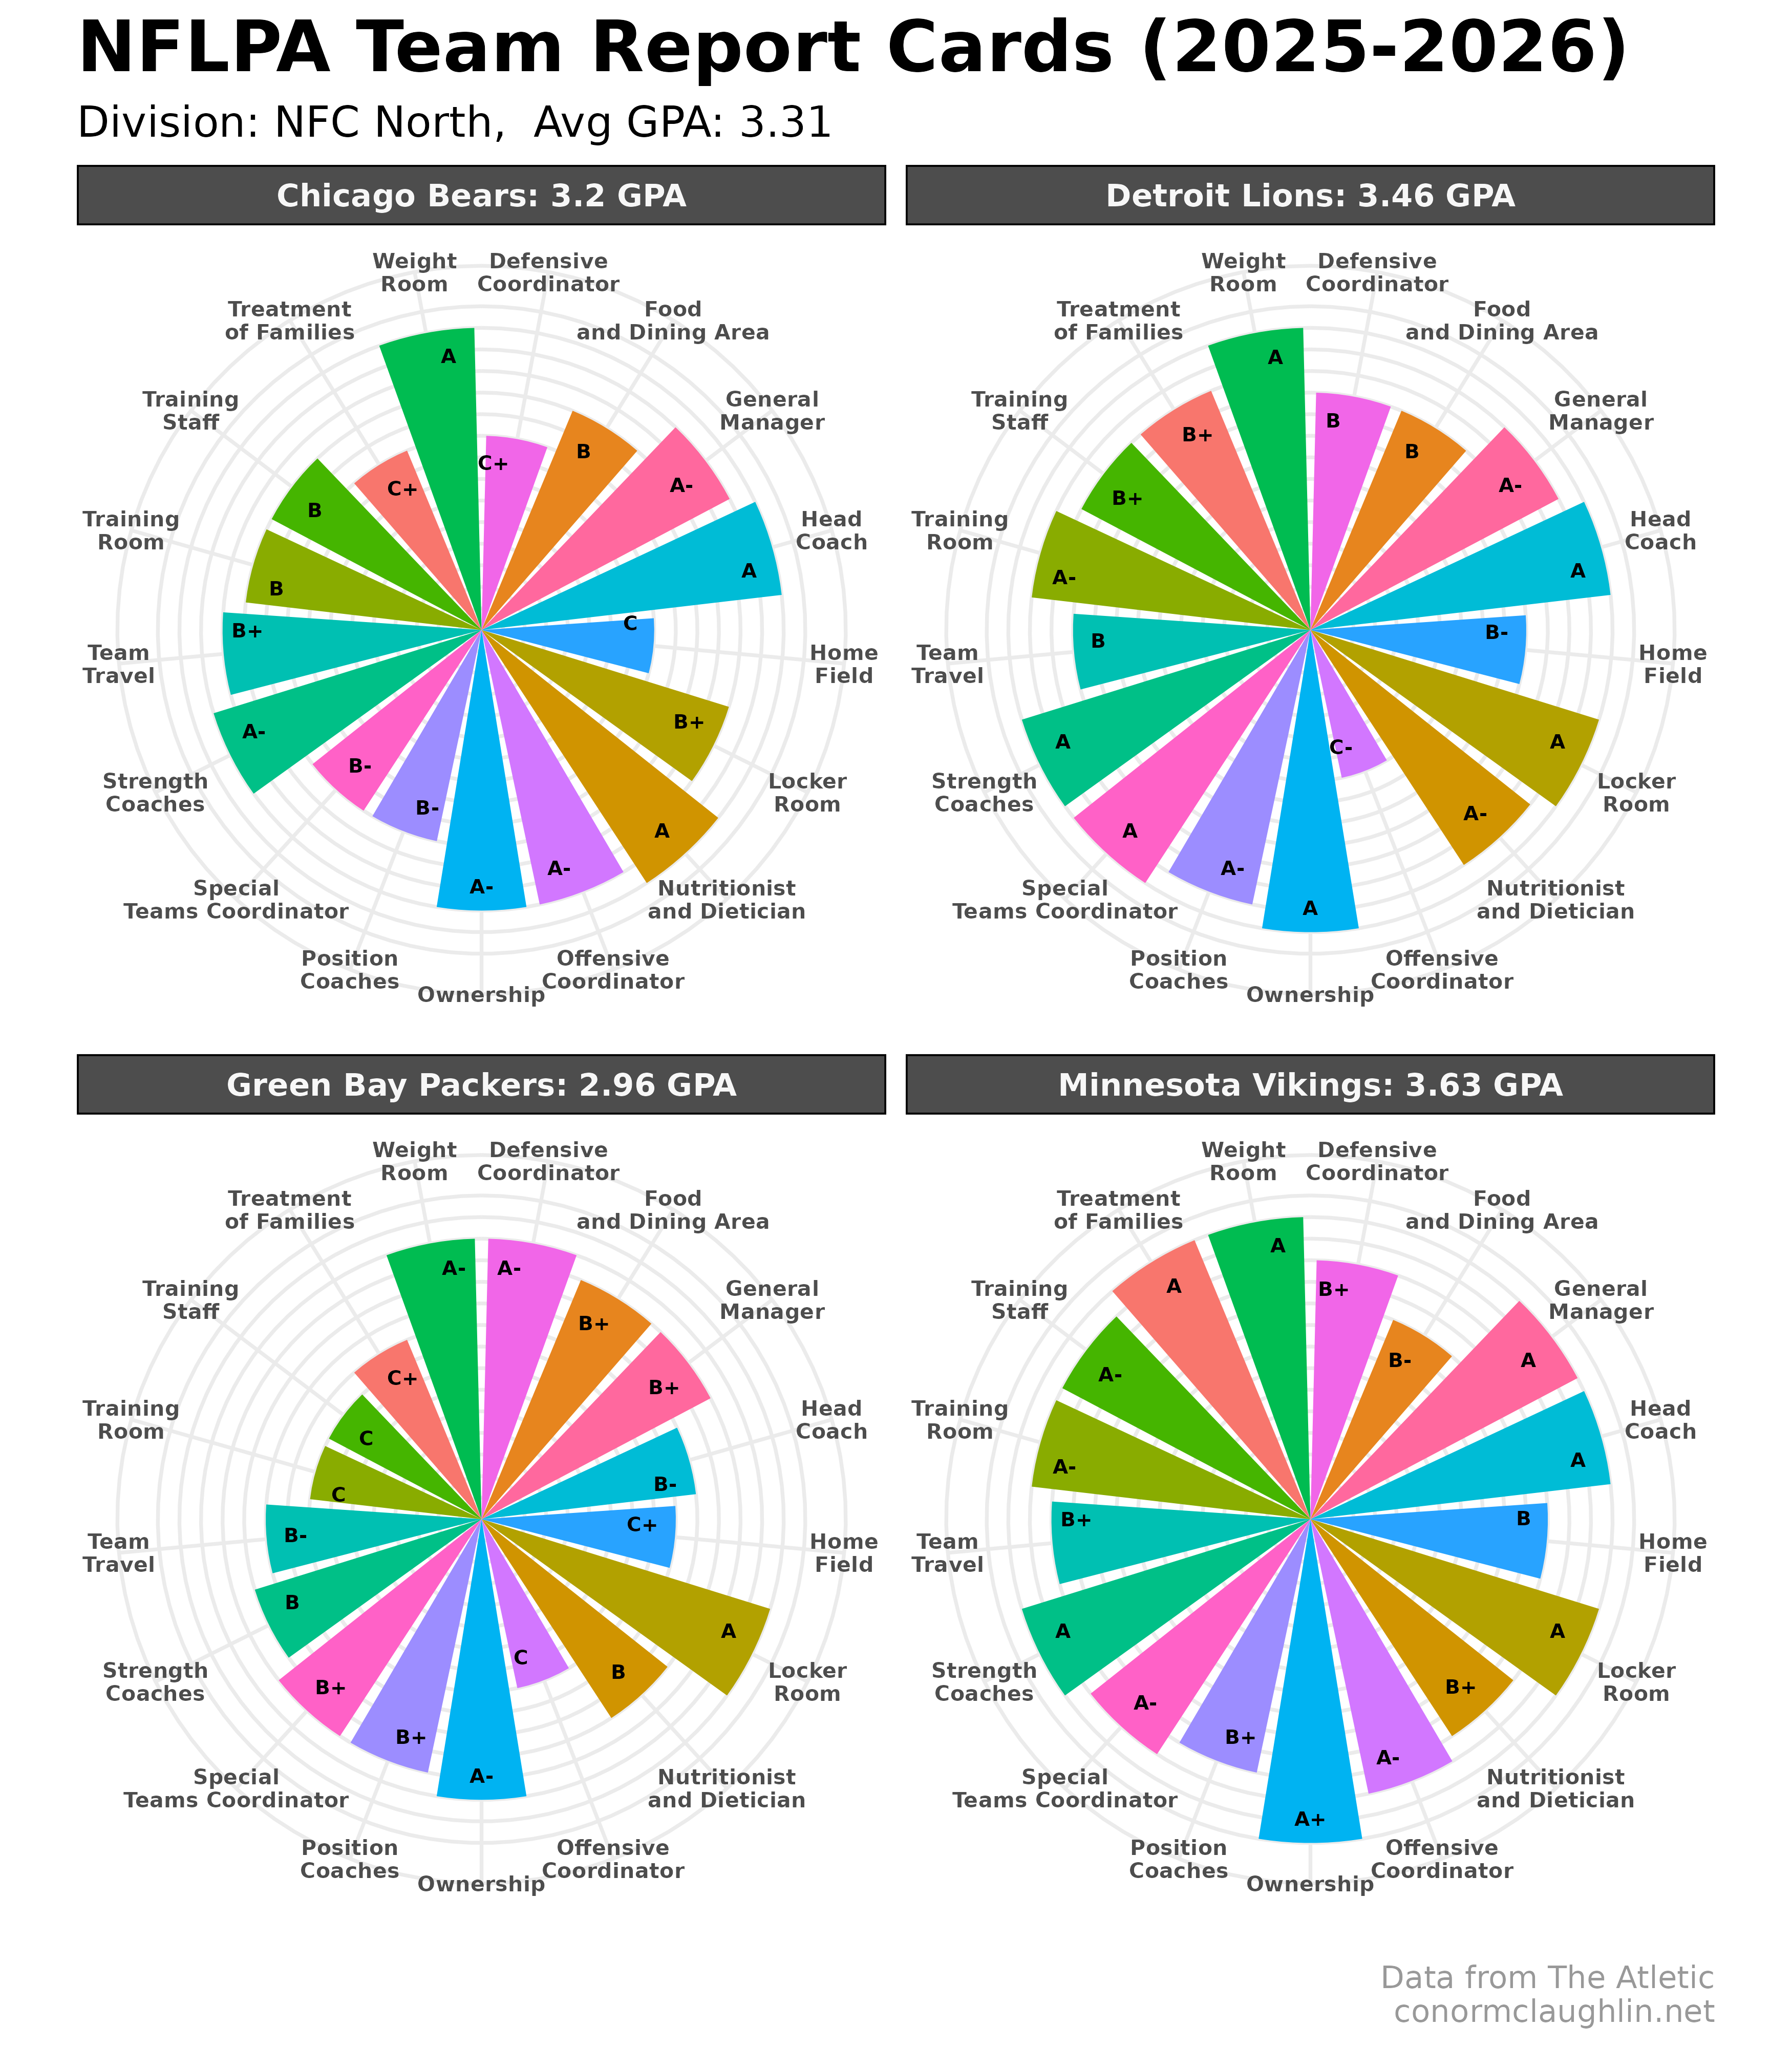
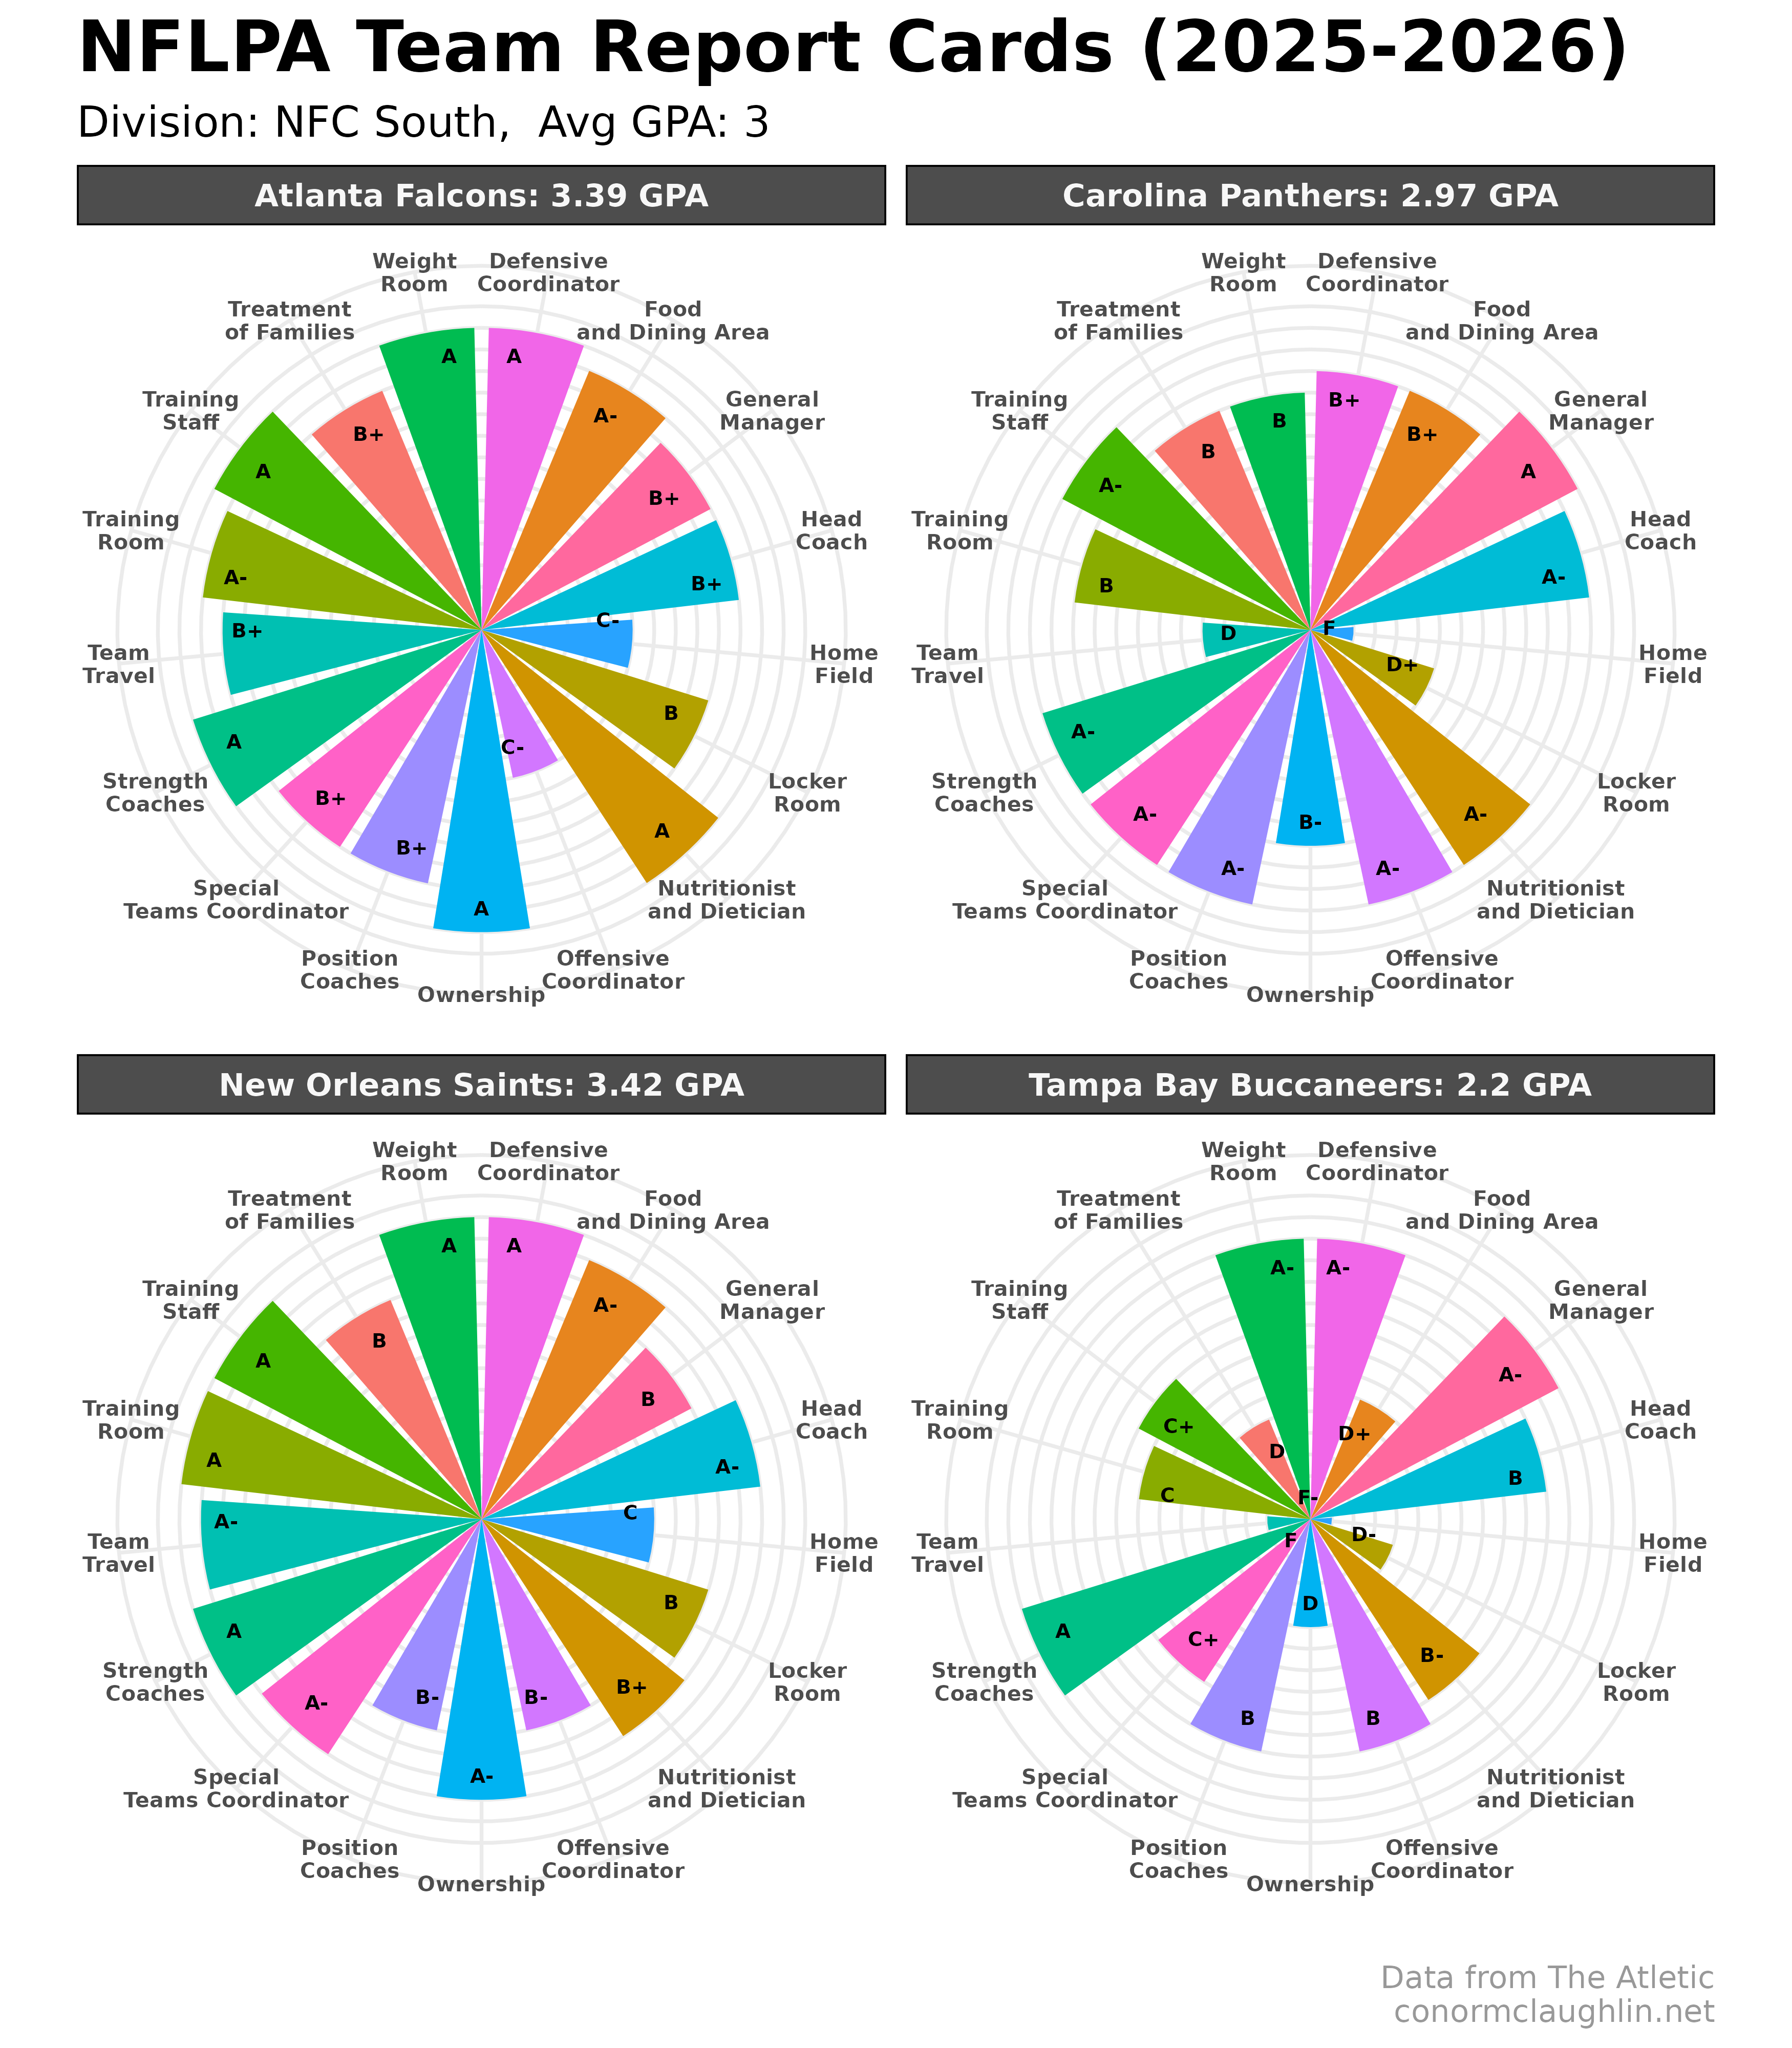
Divisional Circumplex Charts
If these look familiar, it’s because I copied a how-to that I wrote a few years ago to help with the base chart formatting - pretty fun!
AFC East
AFC North
AFC South
AFC West
NFC East
NFC North
NFC South
NFC West