Background
A few days ago at work, I had a fun conversation with a coworker discussing the price of cocktails in LA and how the “standard price” of a cocktail varies from city to city. It’s been my belief for a long time that New York will always set the upper limit on how much people are prepared to spend on their drinks, and over time, that price point slowly trickles down to other markets. However - without any information to back up my point, I was helpless to argue my point in the face of stern opposition from the San Francisco contingent, which likes to have the most expensive everything!
Gathering the Data
To attempt to prove my point (and really, to get any sort of objective data about the bar and cocktail industry), I knew I would need to gather a lot of pricing data. With that said, I quickly ran into an issue - while many things in this world are clearly documented and stored for others to use (looking at you baseball), there is simply no easily accessible source of data for drink and cocktail prices. I knew that if I wanted to go through with this, I would need to collect all of the data myself.
As such, I put together a plan. Using the top twenty metropolitan areas in the United States by population (excluding Riverside/San Bernardino) I trawled through the top ten most highly rated cocktail bars in each city. Then, for each bar, I found a photo of the cocktail/drink menu, and proceeded to record the prices for each standard drink listed. For a typical bar, this was somewhere between 8-12 drinks or so.
I emphasize the phrase standard to note that I did not include all of the drinks in each menu - instead I tried to capture the classic, essential offerings that a regular customer would show up and drink as a matter of course (Old Fashioneds, Mojitos, Sazeracs, etc.). I did this with the hope that we would both be able to compare bars apples-to-apples across the country, and that any pricing discrepancies with very cheap or very expensive liquors or variations might be avoided.
All told, the final dataset included over 2,000 drink prices total sampled across the nineteen cities and broken out by bar. Let’s take a peek at what it shows!
Visualizations
Charting the Distribution of Cocktail Prices
The chart below is a violin plot which represents the distribution of cocktail prices in each of the cities in our sample. I found the violin plot to be particularly useful for showing both the range and concentration of drink prices on a per-city basis in a way that makes them highly comparable.

Takeaways
- New York runs away with the “most expensive cocktail” crown as predicted, with both the highest ceiling and floor on prices
- Notably, NYC is the only market with a substantial concentration of drinks priced at $16, with a second large cohort of drinks sitting at $14
- $12 appears to be the standard price of a drink across most of the major US markets
- I was surprised at the relative expensiveness of cocktails in both Detroit and Philadelphia, given that both are major metropolitan areas, but neither have the reputation for being hugely expensive
- Cities with surprisingly cheap cocktails were Minneapolis and San Francisco, the second of which I did not expect would be so low. Perhaps San Franciscans are saving their money for rent, not drinks?
- Certain cities seems to have prices which cluster more heavily at certain levels, with Tampa, San Fran, and LA being good examples. In contrast to the other cities which have a smoother distribution of pricing across the market, bars in these cities appear to be more tier-based in pricing
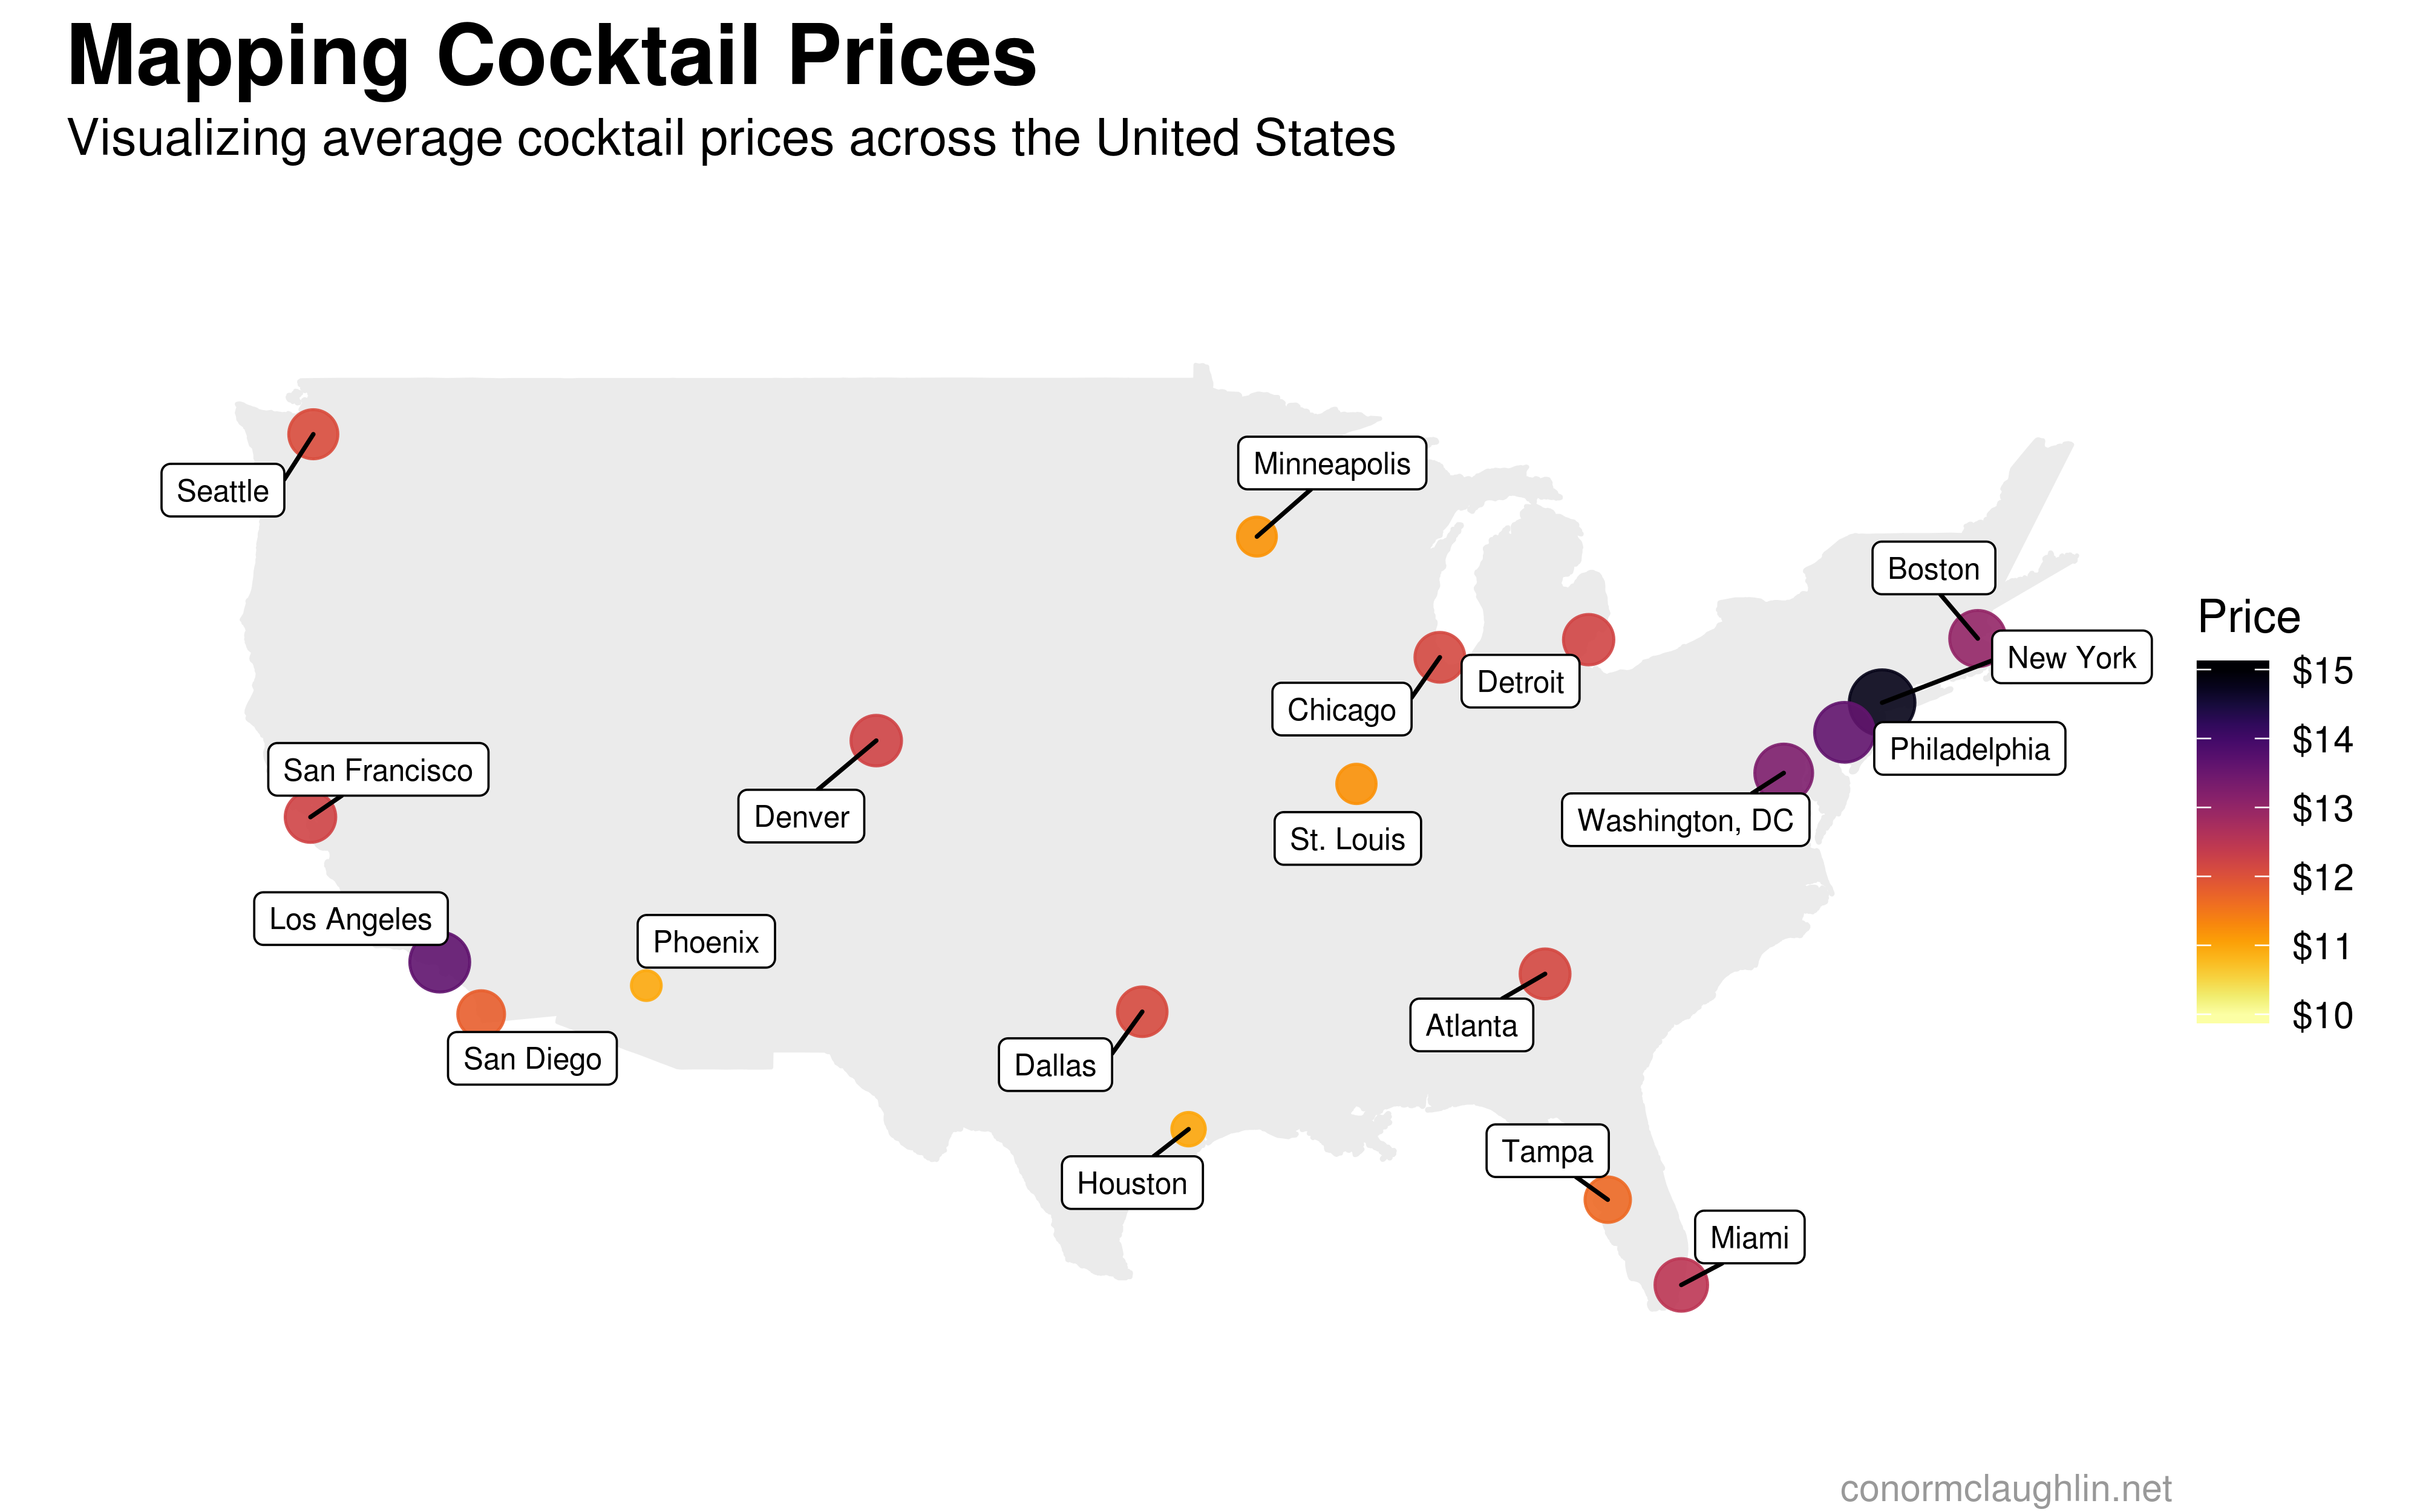
Mapping Average Cocktail Prices
- When visualized geographically, it is apparent that the Amtrak corridor is noticeably more expensive that the rest of the US
- Drinks are generally cheaper in the South and Midwest than on the coasts, which definitely makes sense, but is interesting to see with a totally different price comparison that normal
- Houston and Phoenix are particularly cheap for good drinks - I wonder if it’s all the margaritas….
Summarized Data
| City | Average Price | Median Price | Mode Price |
|---|---|---|---|
| New York | $14.78 | $14.00 | $14.00 |
| Los Angeles | $13.64 | $14.00 | $14.00 |
| Philadelphia | $13.61 | $14.00 | $14.00 |
| Washington, DC | $13.28 | $13.00 | $13.00 |
| Boston | $13.00 | $13.00 | $13.00 |
| Miami | $12.49 | $13.00 | $13.00 |
| Denver | $12.22 | $12.00 | $12.00 |
| San Francisco | $12.22 | $12.00 | $12.00 |
| Detroit | $12.20 | $12.00 | $12.00 |
| Atlanta | $12.14 | $12.00 | $13.00 |
| Chicago | $12.13 | $12.00 | $12.00 |
| Dallas | $12.11 | $12.00 | $12.00 |
| Seattle | $12.05 | $12.00 | $12.00 |
| San Diego | $11.80 | $12.00 | $10.00 |
| Tampa | $11.67 | $12.00 | $12.00 |
| St. Louis | $11.21 | $11.00 | $12.00 |
| Minneapolis | $11.19 | $12.00 | $12.00 |
| Houston | $10.98 | $11.00 | $12.00 |
| Phoenix | $10.94 | $11.00 | $12.00 |