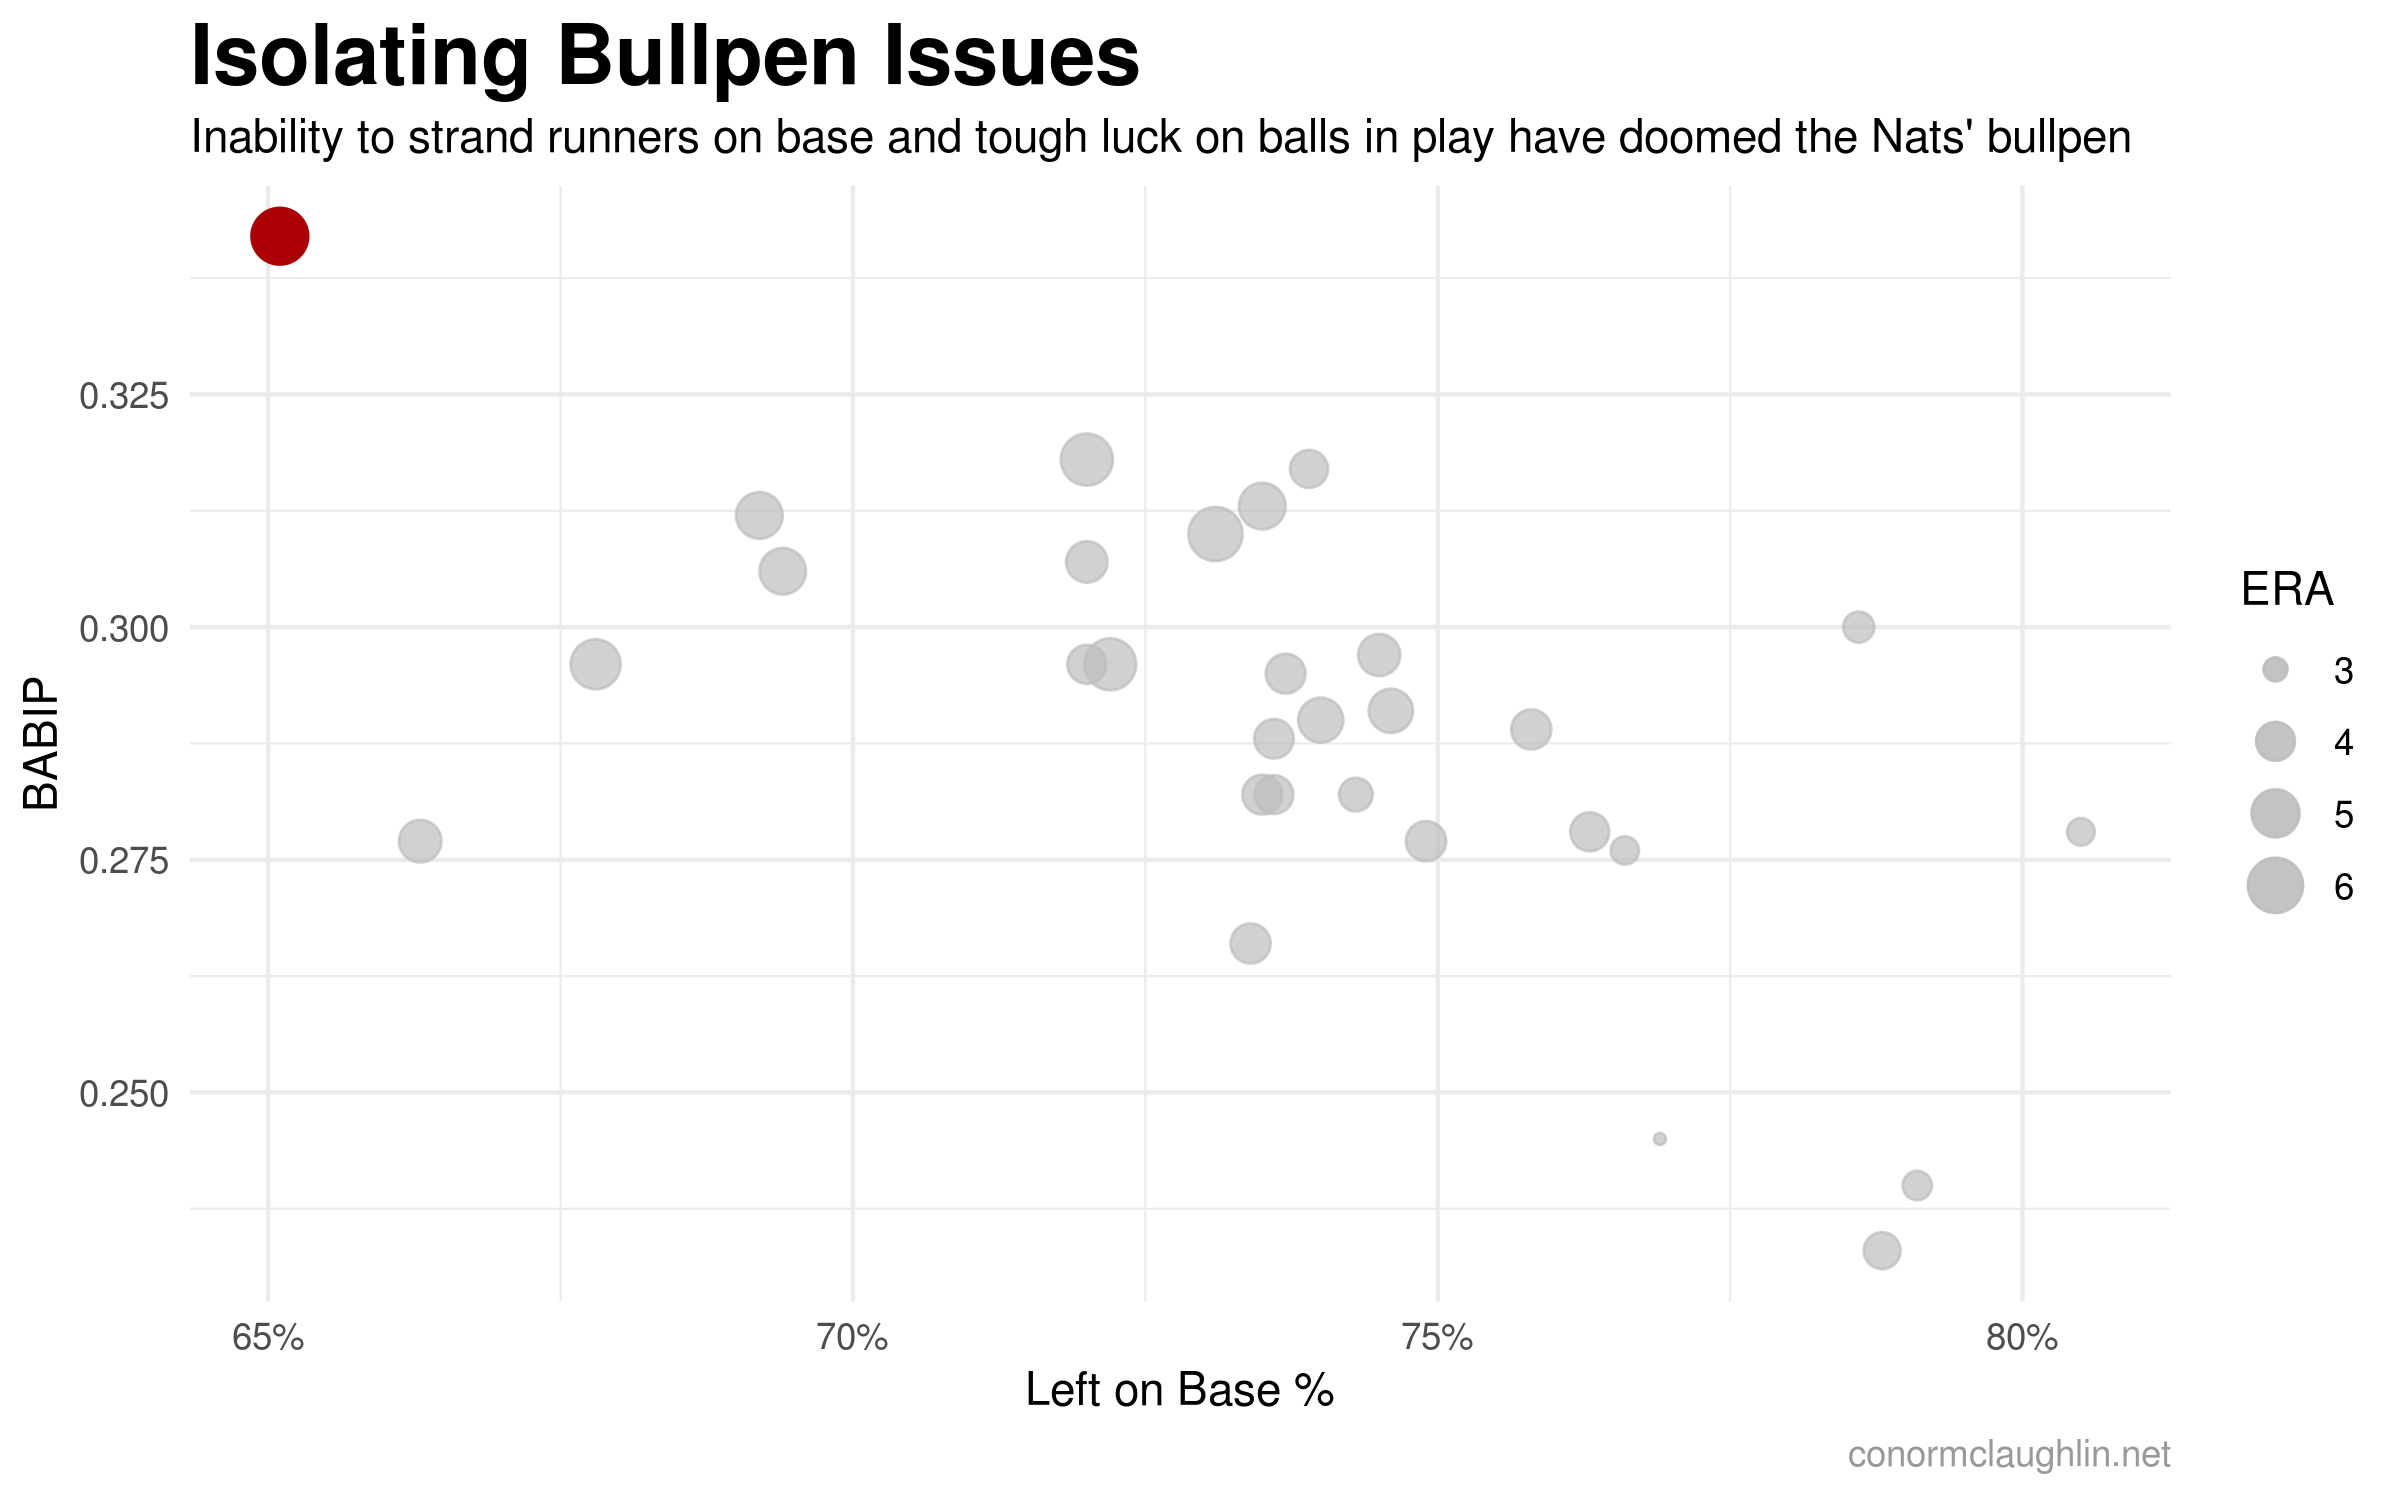
Two weekends ago, my Nationals lost a tough series to the New York Mets, largely due to clutch late-game hitting from the Mets and some poor relief pitching by the Nationals. What they did do right, however, was grind out tough at-bats against both Noah Syndergaard and Jacob DeGrom, two of the best starting pitchers in all of baseball. They gave DeGrom a hard time in particular, forcing him to throw 101 pitches over just 5 innings in a game the Nationals ended up winning 7-4.


