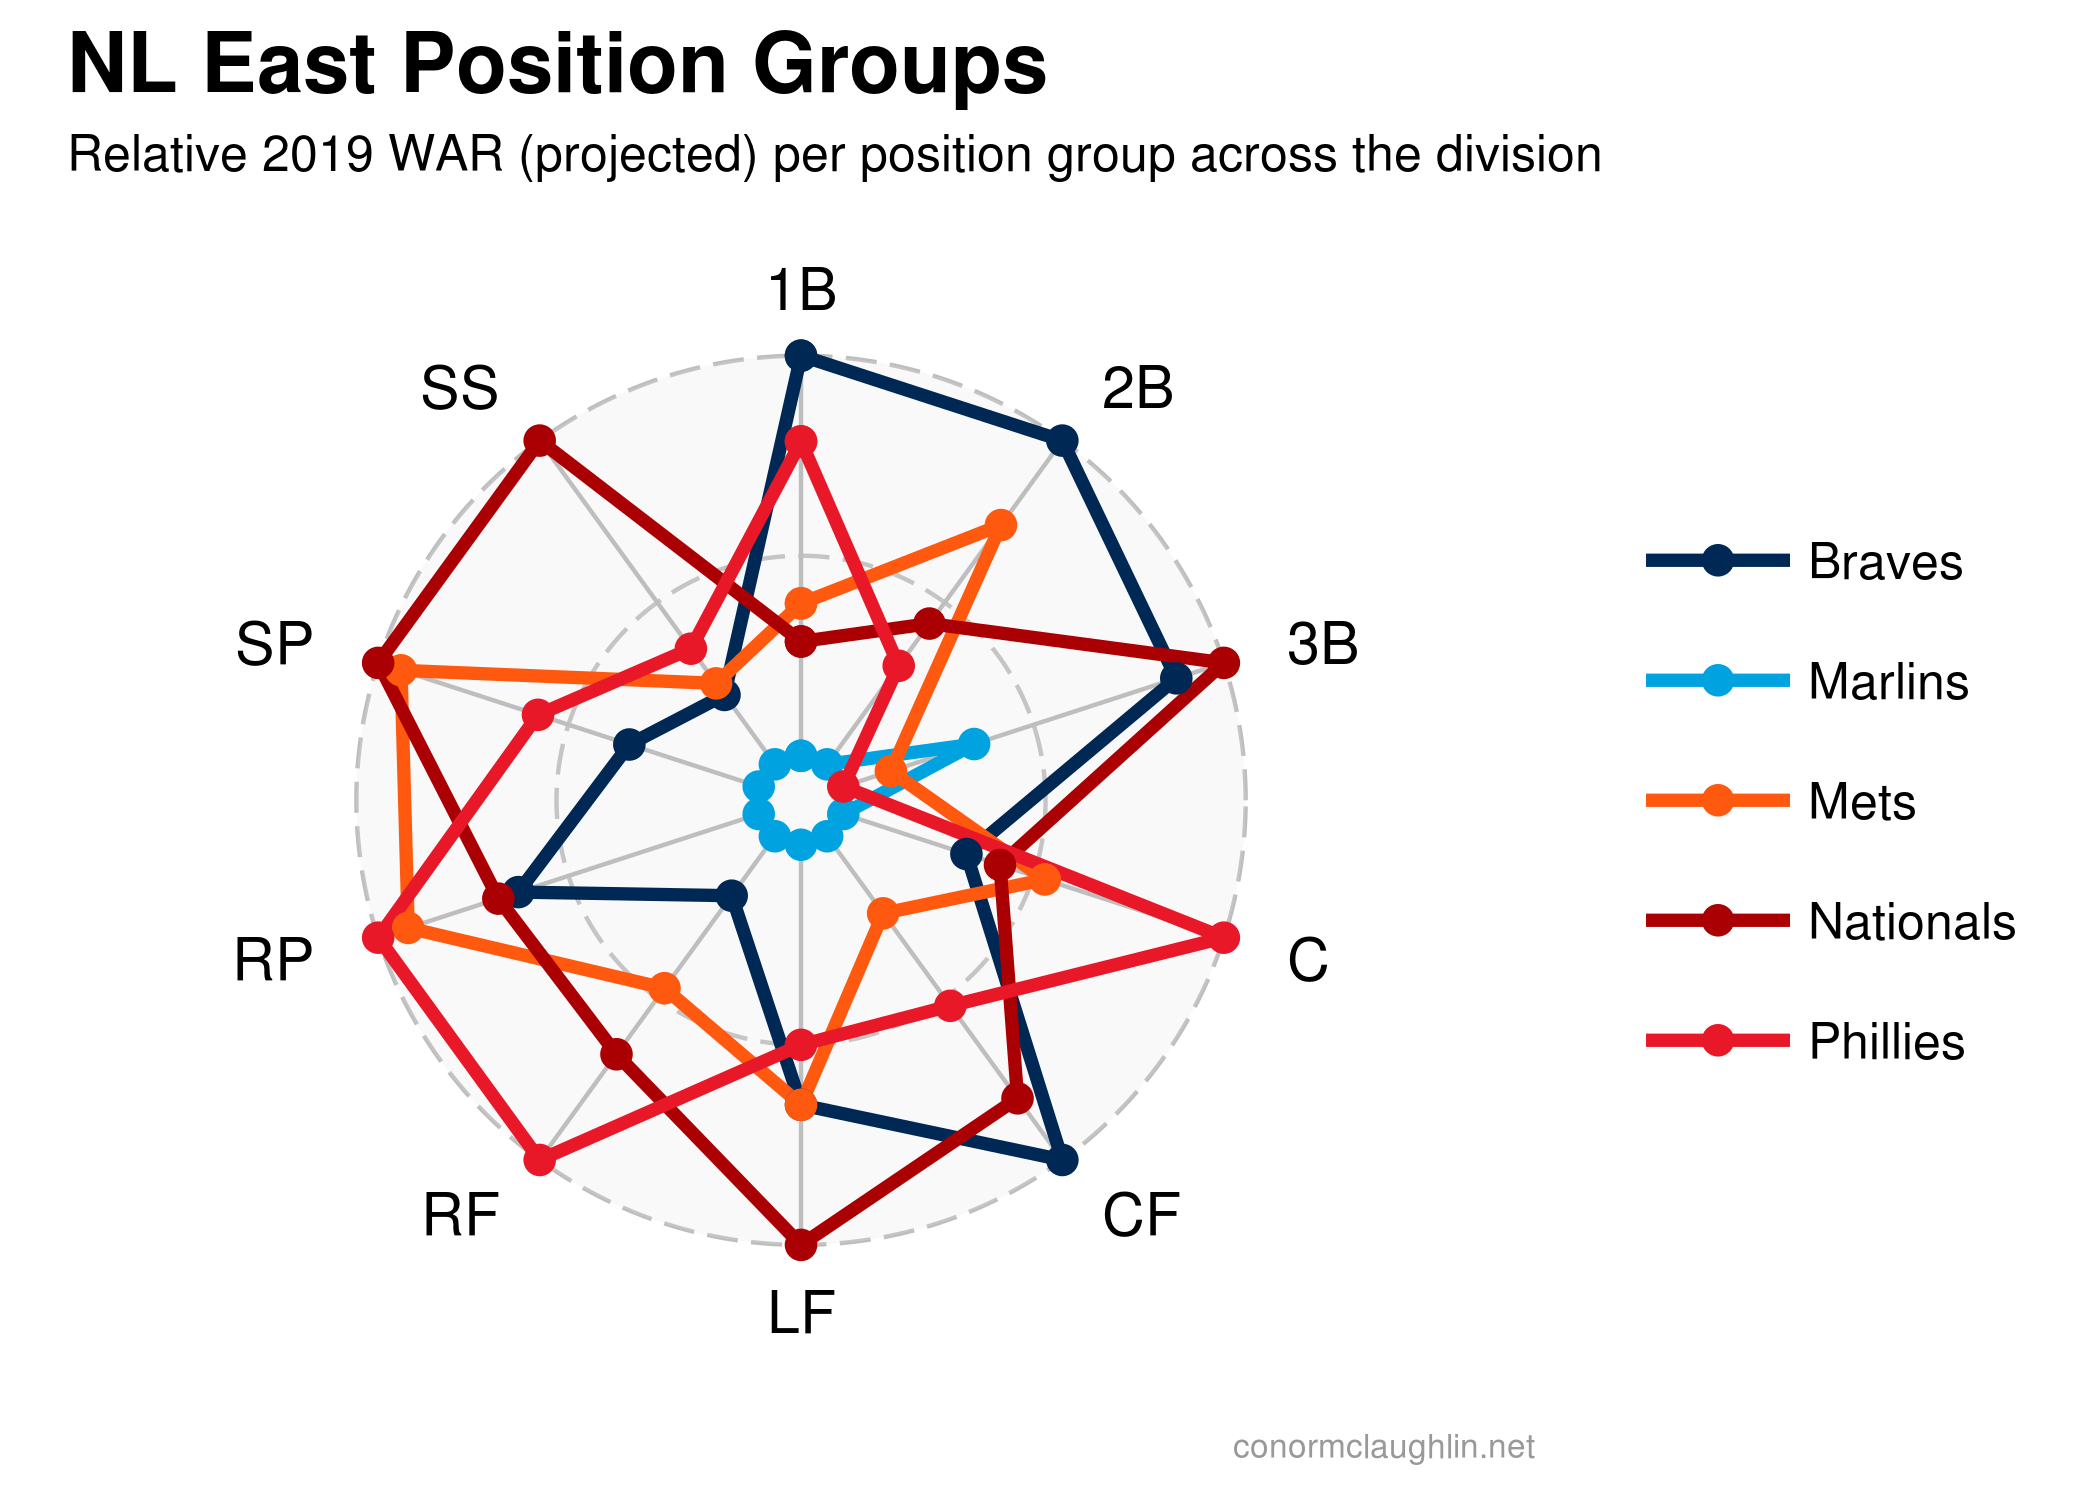
Mapping the Big Mac Index


If you haven’t heard of it before, the Big Mac Index is a heuristic invented by The Economist to estimate purchasing power parity across economies. Looking past the numbers-to-numbers layer of exchange rates, the Big Mac Index is focused on measuring the cost of a single, standardized item (voila, the Big Mac!) across countries, and examining where the burger is relatively expensive and inexpensive compared to the rest of the world.

Read More

US Airline Flight Maps


No real story here - just wanted to make some fun airline maps! The graphics you’ll see below were created by mapping hub airports for each major US air carrier and then showing flight traffic to and from all other major flight hubs. Cities are sized by the relative passenger volume of all connecting flights through that destination.

I’ve (tried to) follow each airline’s brand guides for color and styling on each map. Some, like American and Virgin, turned out great, while other color palettes like United and Southwest didn’t map as well to a two-color format… 🤷‍♂️

Read More

One Man Wrecking Crew: Examining James Harden's 2019 Brilliance


One of the most enjoyable plotlines of the 2018-2019 NBA season has been James Harden’s transformation into a one man wrecking crew, capable of guiding a surging Rockets team up the standings in the West despite losing virtually every other “name brand” contributor on the Rockets roster.

Minus Chris Paul (out since 12/20/2018), Eric Gordon (12/29/2018), and Clint Capela (1/13/2018), Harden is putting up statistics not seen since Wilt Chamberlain - over the past week of play, Harden has put up a truly insane 58/6/8 line, and has averaged close to or over 40 points for more than a month of play. While the Rockets looked a bit washed out of the gate this season (Carmelo wasn’t exactly helping), they are surging up the tight Western Conference standings, mostly due to the excellence of one man. Let’s take a peek at some visuals that can help show just how special Harden has been over the last month or so of basketball!

Read More

Turning your Raspberry Pi into a Cloud-Connected Thermostat


Temperature Dashboard

Vision

This fall I moved into a new house, which I quickly learned has an extremely unreliable thermostat. As someone who likes to be cool in the evening for bedtime, but also doesn’t love wearing sweaters indoors, I wondered if there might be a better way of monitoring my house’s temperature.

Fortunately for me, I had a surplus Raspberry Pi lying around, which I quickly determined could be leveraged into serving as the brains of my thermostat, given the right input sensors. Plus, the Pi easily connects to the AWS IoT interface, which would allow me to transmit data to AWS and then process and save that data in a variety of locations for analysis.

Read More

UVA Basketball Season Preview and 2017-2018 Shot Charts


UVA Basketball

Background

One of my favorite things in the world (except for one particular night this March) is watching my Virginia Cavaliers play basketball. I’m particularly excited about this year’s team, which I think is one of the deepest in recent memory and is going to be highly motivated all season coming off of last year’s disappointing finish against UMBC. I’ll leave the detailed analysis of their performance to the professionals over at Streaking the Lawn, but wanted to share a bit of work I put together on our most important returning players.

Read More

What President Trump's Calendar Reveals About His Presidency


Background

One of the most frustrating aspects of the Trump administration is the lack of honesty around simple things, from President Trump’s White House visitor log to his golf outings. However, thanks to the work of Factbase, there does exist a fairly comprehensive database of the President’s public schedule, which outlines his activities in the White House and his domestic and international travel.

To see what data and trends we might be able to glean from this information, I ingested the entirety of President Trump’s public calendar and press pool schedule, and built a series of visualizations highlighting what I felt were the notable trends. Note that exact while exact amounts may be imprecise due to how Factbase’s data is collected, many of the trends are clear and meaningful. Please see my key takeaways below!

Read More

NBA Scoring Leaders and Most/Least Improved Players


NBA Scoring Leaders

Now that we’re a few weeks into the NBA season, it’s fun to see who is having note-worthy starts to the year. The chart above shows the top twenty scores in the league by game and their gain/decline relative to last season. It’s fun to see players like Kemba Walker and Zach LaVine elevating their games amongst the league elite thus far this year, and will be intersting to see if they can continue to keep pace with the likes of Curry, Durant, and Lillard.

Read More

NFL Penalty Trends


Background

If you’re a fan of the National Football League, so far this season you’ve heard an uninterrupted string of commentary surrounding penalties, rule changes, and the role of violence in the game. This is a fascinating topic because a number of greater trends have coincided to cause this moment - particularly the NFL’s desire to protect quarterbacks, rule changes that have reduced the amount of practice time teams have during the offseason and between games, and game-calling decisions designed to encourage passing and free up downfield receivers. Put together, these factors have led to a slow inflation in the number of penalties called per NFL game, which is now reaching a tipping point.

Read More

Cross Country Roadtripping


A little over two weeks ago, my dad and I set out on a week-long adventure across the United States. Starting in DC and ending in Santa Monica, we spaced the trip out over seven days so that we would have a few free hours each day to stop and explore along the way! Check out the driving schedule we decided on below…

sdf

Trip Statistics

To distract us from our boredom along the way (looking at you, Indiana and Kansas), we tracked all of our gas fill-ups throughout the trip. Since we were pulling a U-Haul trailer, and knew there would be some significant elevation changes when going through the Appalachian and Rocky Mountains, we were curious to both have visibility into our gas usage, and some rudimentary miles-per-gallon data along the way.

Read More

Visualizing Uber Rides


Recently, I discovered that I had set up my IFTTT account to log all of my Uber rides to a Google Sheets workbook. News to me! After some investigation, I found about six months of Uber ride data, nicely categorized with time, location, and driver data for each trip. If you’re looking to do any sort of analysis, or are interested in tracking your Uber rides, I highly recommend this IFTTT applet!

Read More